Analytics Menu
Click  to open the Analytics Menu. The Analytics Menu allows you to open a folder, report, or dashboard at anytime while working in Analytics.
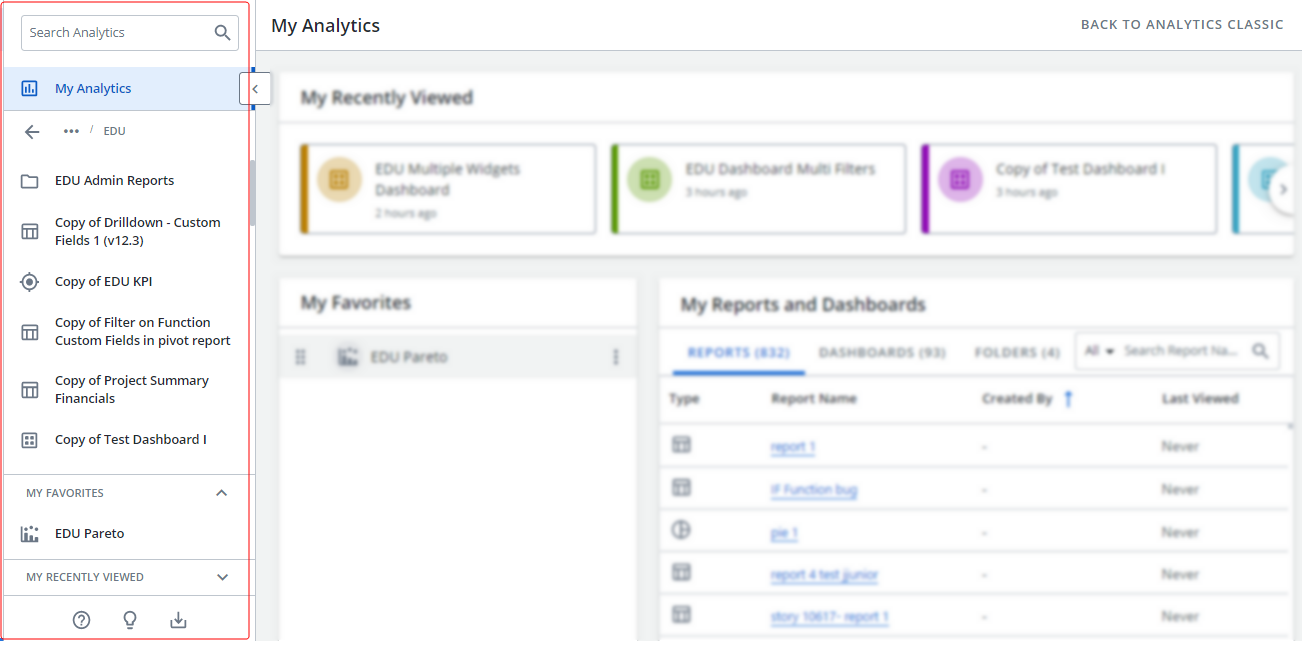
The Analytics Menu contains the following:
|
Search Analytics: |
Type the name of the folder, report, or dashboard that you are searching for in the box and the search results display in the document tree. |
||||||
|
Document Tree: |
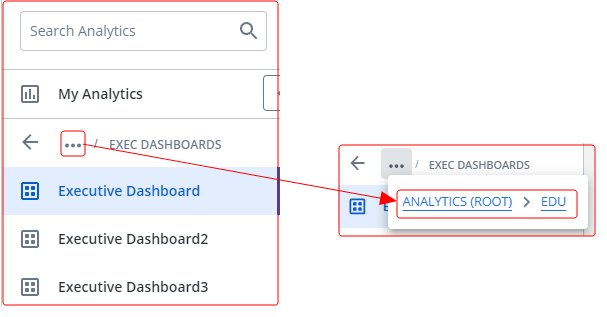
The document tree displays all of your available folders, reports, and dashboards. Click each folder to navigate through the folder structure. Click on a folder, report, or dashboard to open it. Click the arrow to return to the previous folder. To see how to navigate back to a parent folder, click to play. When you click on a report or dashboard that is nested in folders, a breadcrumb displays.
To return to previous folders, click the arrow or click the three dots to display links to previous folders and then click the folder that you want to return to. Note: We recommend that you only have three levels in your folder structure. |
||||||
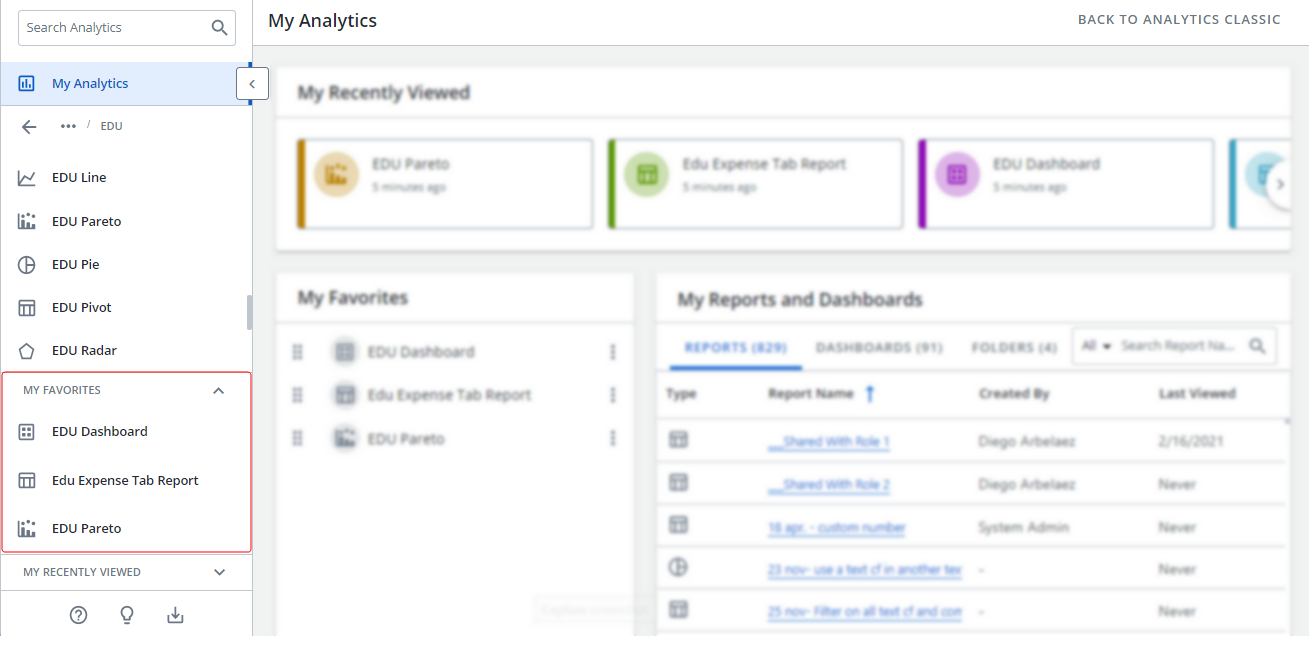
| My Favorites: |
Click the dropdown arrow in this section to view the reports and dashboards that you added as a favorite and then click the report or dashboard you want to open.
|
||||||
|
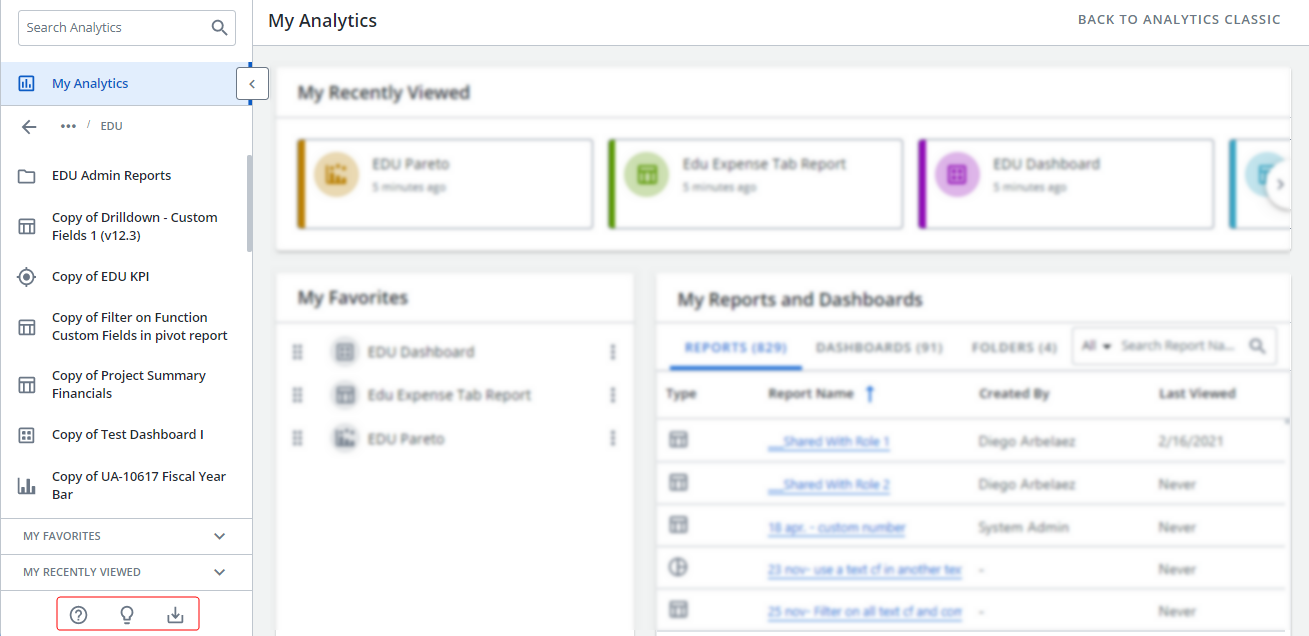
My Recently Viewed: |
Click the dropdown arrow in this section to view the reports and dashboards that you have recently viewed and click the report or dashboard you want to open.
|
||||||
|
Icons: |
The icons at the bottom of the Analytics Menu are:
|