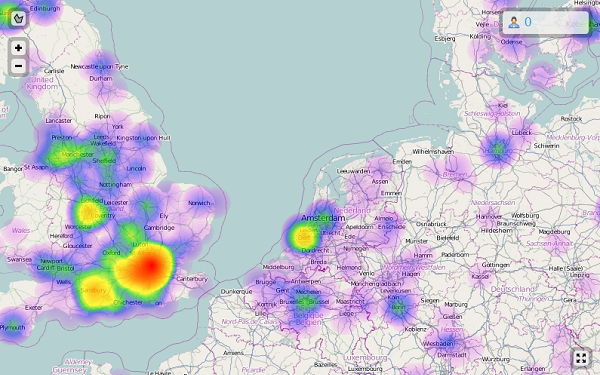
The geo tracking report gives a visual representation of where your contacts are opening emails, with a heatmap overlaying a world map. The report also features a polygon tool to draw a selection around groups of contacts for segmentation.
The report is part of the Campaign Report under the 'Geo Tracking' tab, which you can access via the 'Report' tab at the top of the campaign.
On this page:
Map
The heatmap works on a colour scale of purple, through blue, green, yellow, orange and red. The highest concentrations of contacts opening emails are represented in red and the lowest in purple.
Opens are counted when recipients open the email but many mail clients will block images by default. The Geo Tracking report will not be able to register the open unless the user chooses to display the images.
Note: Geo Tracking cannot record the location of emails opened on mobile devices, unless the device is using a wireless connection.
You can zoom in and out of the map using + and - buttons in the top left corner of the map, or using your mouse wheel. To move around the map, click and drag to reposition it.
You can also expand the map to the full size of your browser using the full screen button in bottom right corner of the map. Clicking the button again will return the map to its normal size.
Selecting Contacts by Area
You can select groups of contacts by location area using the polygon tool in the top left corner of the map.
To start a new polygon click the polygon button, and then click on a place on the map where you want to begin. You can then click as many points as you need to on the map to define the perimeter of the polygon.
To complete the polygon you can either click on your first point or click the 'Complete Section' button at the bottom of the map. You can cancel a polygon by clicking the 'Cancel Selection' button, or to clear an existing polygon, click the 'Clear Selection' button which will be available at the bottom of the map once a polygon is complete.
To adjust the area of the polygon, click and drag the points into new positions.
The contact count in the top right corner shows the number of recipients within the selected area. If you adjust the polygon, the contact count will update to represent the new area. You can click count to browse the contacts in the data viewer.
Cities
The cities tab lists the cities in which the email has been opened and the corresponding number of contacts for each city, which you can browse by clicking the total. The number of contacts represents the number of contacts who clicked in each city. A contact may have opened your email in more than one city, in which case they would appear in more than one count. This means that the combined city counts may add up to more than your total contacts.
Countries
The countries tab lists the countries in which the email has been opened. As with the cities tab, the number of contacts represents the number of contacts per country. If a contact opened your email in more than one country, they would appear in more than one count, which means the combined country counts may add up to more than your total contacts.
FAQ
Can Geo Tracking be used with any browser?
The map will only work with modern browsers, which include the most recent version of Chrome, Firefox, Edge, and Safari. If you are using an old browser, for example Internet Explorer, you will still have access to the basic reports showing the number of contacts opened per city and country.
Why are my Geo Track opens showing in America?!
This is an odd one; if you're using a Google based mail client the tracking image is cached at Google's IP address in California, rather than your own. This means it will be logged as an open at Google's location.
If tracking is showing opens elsewhere when it shouldn't, contact Adestra Customer Support (adestra-support@uplandsoftware.com).