Manage Your Enterprise or Portfolio Whitespace: Introduction
Learning Objectives
After completing this topic, you’ll be able to:
- Explain how revenue teams target white space in an opportunity map to focus business-development activities in an account
In account management, "white space" is the unexploited territory where you may be able to generate new revenue by developing opportunities to deliver additional value into an account. Broadly, there are three possible sources of new revenue within existing accounts:
- Business you've already won that you can expand.
- Business you can take away from competitors.
- Revenue possibilities that no vendor has yet exploited.
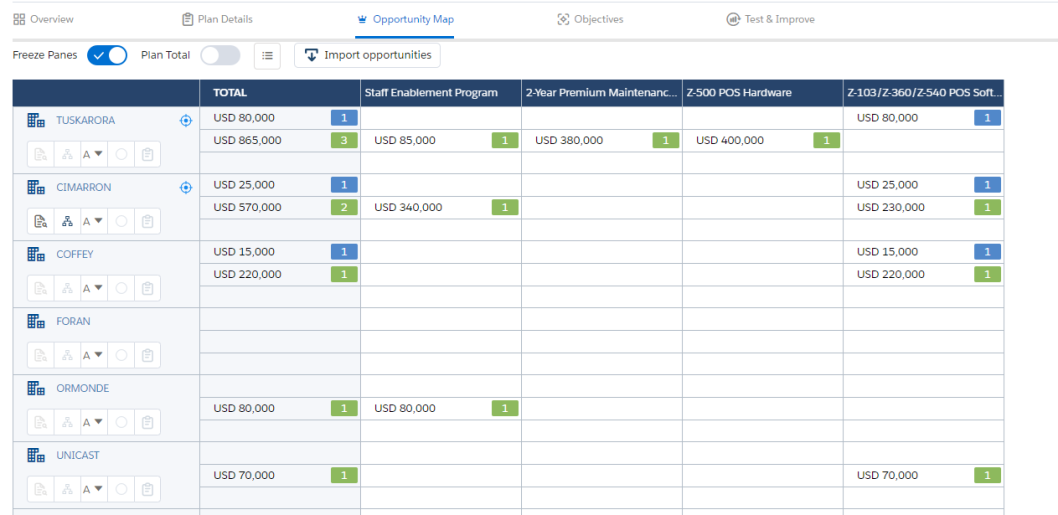
An opportunity map gives you and your revenue team a focused way to manage and target white space in your Account Manager plan. On the map, accounts are rows and solutions are columns. At each row–column intersection, there can be:
- Potential opportunities. These are ideas for possible revenue generation that need further analysis before they can be converted into real opportunities in the pipeline.
- Current opportunities. These belong to the active pipeline – revenue that the company may be able to win.
- Won opportunities. These are revenue that's already been won in the account.
Lynn Benfield is an account executive at Riley Retail Solutions, a supplier of point-of-sale (POS) technologies. She and her revenue team are working on an Account Manager plan to retain and grow revenue with the Oriole Group, an enterprise with a number of subsidiaries involved in different areas of the health industry.
Lynn recently closed a deal with one of the divisions, MyHealth, and she wants to build on that initial success.
She and her team have started their opportunity map and are now in a position to assess it for new sources of revenue.
Opportunity Map "Value" View
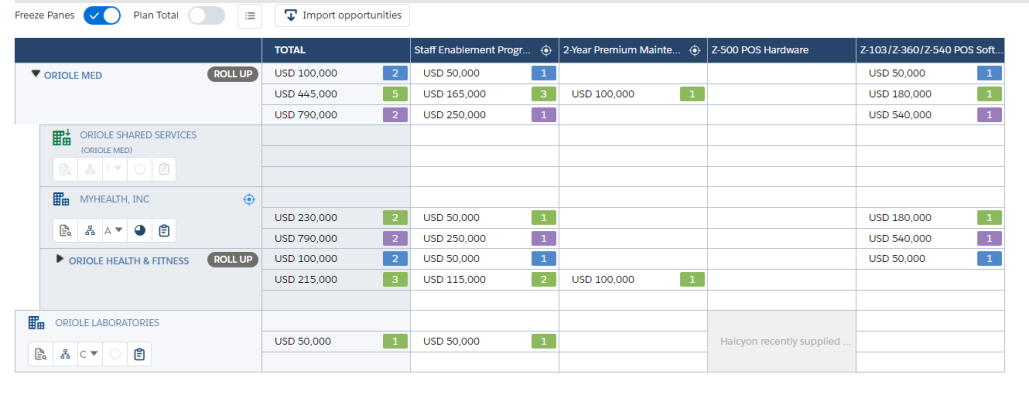
The opportunity map's Value view, shows:
- Potential opportunities (blue). This is the potential business the team is trying to assess.
- Current opportunities (green). This is revenue the team is actively pursuing.
- Won opportunities (purple). This is revenue the team has already won.

A roll up row can be expanded to show the account and division rows within.
Market Landscape
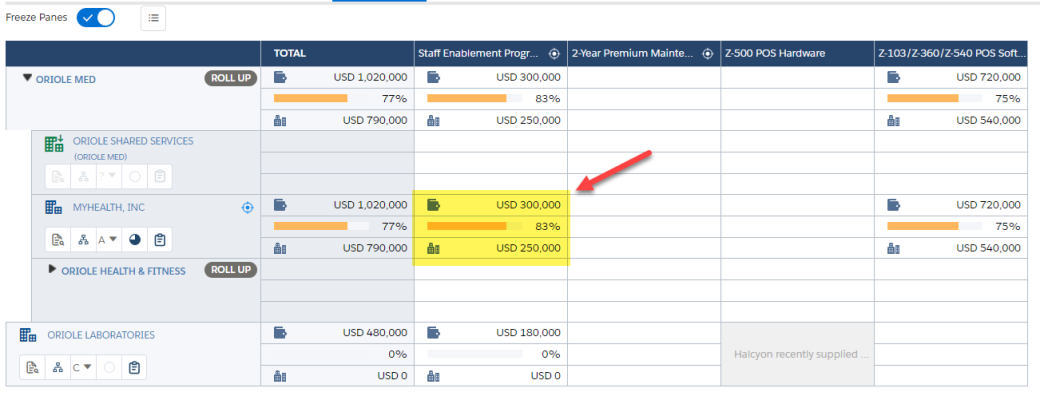
When Lynn switches to the opportunity map's Total Addressable Market (TAM) view, she can:
- See the value of the TAM for her competitive takeaway opportunities (those where she may be able to take business away from a competitor) in each account.
- Specify her current share of this "wallet" compared to competitors.
She specifies, for example, that the TAM on the MyHealth account to provide staff-enablement services is $300,000. She arrived at this estimate based on a $500 price for each of their 600 employees.
She identified that her company's current contract to provide an enablement program solution to MyHealth is $250,000. This gives her 83 percent wallet share.
Lynn believes she can take the remaining 17 percent share away from Halcyon, the competitor who holds the current contract for that remaining business.
Upcoming Renewals
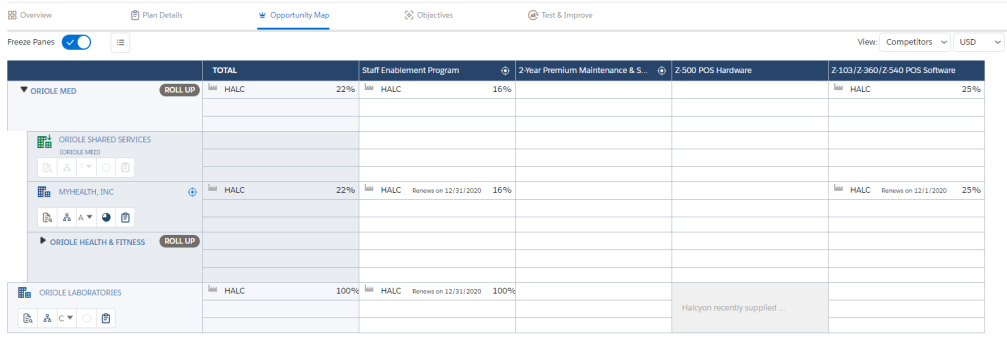
As part of setting wallet share above, Lynn also specified when current contracts are coming up for renewal – both her own company's and those of the competitors (where she has this competitor information).
When she switches to the Competitors view, she gets an easy way of seeing these contract renewals:
Targeting White Space for Potential Revenue
There are three kinds of white space that Lynn wants to target:
- Business she's already won that she can expand
- Business she can take away from her competitors
- Revenue possibilities that no vendor has yet exploited
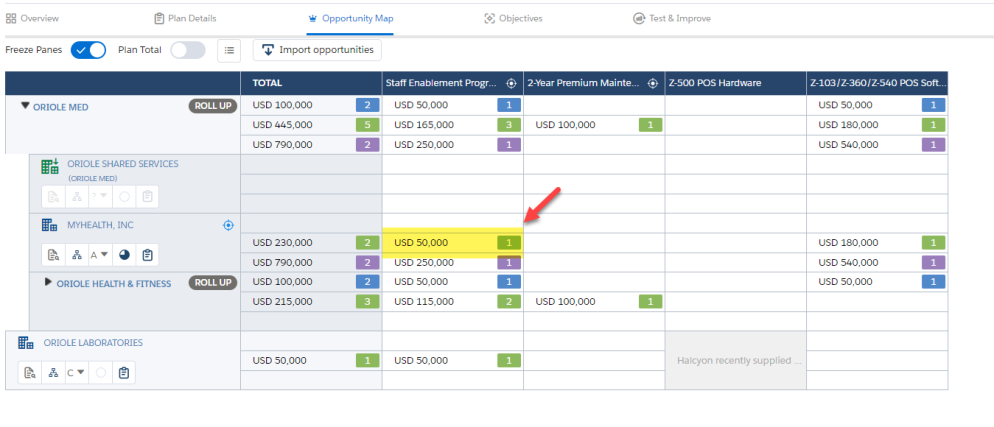
On Lynn’s map, she's already won $250,000 of business with the MyHealth division to provide an enablement program (the purple opportunity on the MyHealth row).
She and her revenue team aim to grow that business. You can see on the map that they're currently pursuing a deal for an additional enablement contract. This is the opportunity worth $50,000 (the green opportunity on the MyHealth row) that Lynn identified when she looked at wallet share in the TAM view.
On Lynn’s map, she sees that Halcyon, a competitor, currently has 100% of the TAM for staff enablement at Oriole Laboratories.
Halcyon's contract comes up for renewal in just a few months – the timing is good to take that business away from them.

(She and her team will also need to be mindful of when their own contracts come up for renewal – competitors will look to take that revenue from them.)
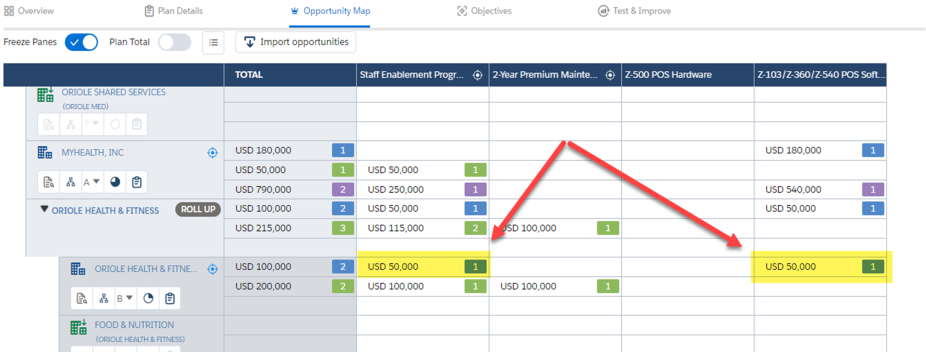
Lynn believes she may be able to cross-sell her software and enablement solutions into Oriole Health & Fitness. She's added potential opportunities for these to her map.
Her team will do some business development work to try to qualify this business
"Blocked" White Space
Lynn can "block" areas of the opportunity map where there's currently no opportunity to generate revenue.
In the example above, she's blocked the Oriole Laboratories – Z-500 POS Hardware intersection, and added a note explaining that a competitor has just signed a four-year deal to provide a similar product to Oriole Laboratories.

Opportunity Map for a Portfolio Plan
Opportunity maps can be very useful not only for Enterprise Account Manager plans but also for other types of plan, such as portfolio plans.
In the example below, you can see how an account executive can target white space across a portfolio of accounts.
