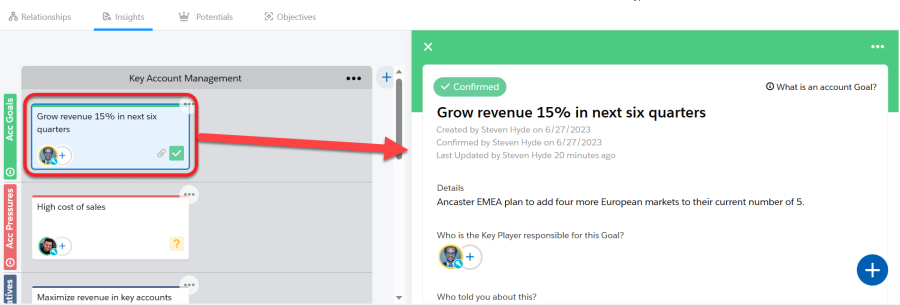
An insight map gives you an easy way to develop a compelling story about the customer's business issues. It works like sticky notes on a physical board.
With insight maps, you can:
-
Quickly add ideas to the insight map as insight 'cards'.
Tip: It’s okay to use assumptions at first but the map should be updated as insights are validated or discounted.
- Add further details to the cards as your ideas mature.
- Import insights from other insight maps or the account's insight map (if you are working on an opportunity insight map).
- Share your insights with colleagues working on similar opportunities.
- Structure the insights into a coherent story of the customer's business issues.
- Organize the insights into sections that tell sub-narratives.
- Switch to presentation mode to show the map in slideshow format. (This is useful when you're presenting it to the customer.)
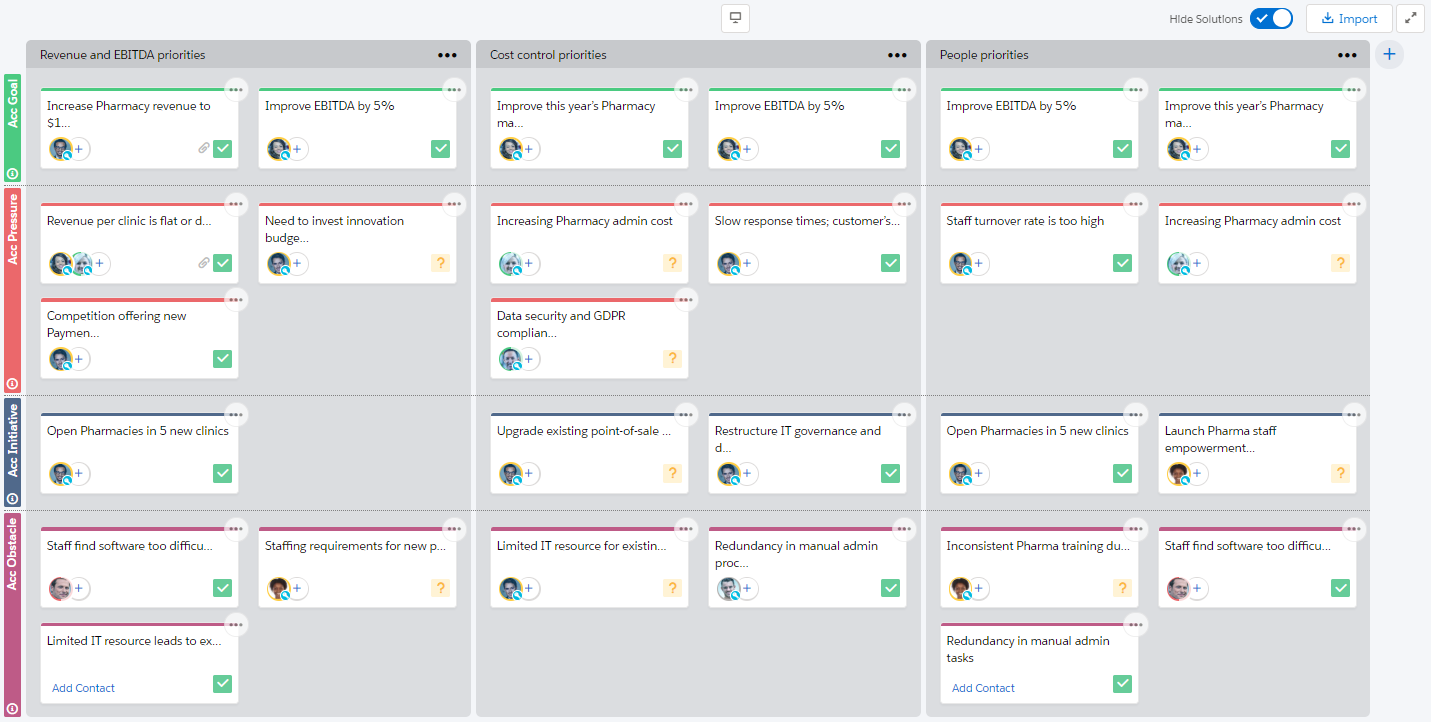
Note: If you are working on an account insight map and divisions are created for the account, the account and each division is allocated its own map (see Viewing Division Insights). This means that when you add an insight, import insights, add a section, or share and tag your map, only the currently viewed account or division map is updated.
The insight map has five levels: Goals, Pressures, Initiatives, Obstacles, and Solutions.
You can quickly add an insight to any level by clicking the workspace and typing its name. In this example, you're adding a new initiative:

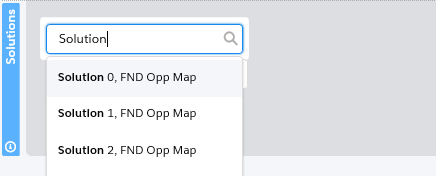
If you are adding a solution, you have the option to select a template solution (as shown below). These are created by your administrator.
When you click an insight's card on the map, its details panel opens on the right - as shown in the example below.
As your understanding of the customer's business issues matures, you can add information to insights using the details panel. Each type of insight (goal, initiative, etc.) has its own particular set of details that you should capture.
Date stamps on the details panel ('Created by', 'Confirmed by' and 'Last Updated') are helpful indicators of the origin and relevance of the insight.
A fully-developed insight card looks like this:

- The card shows the contacts who have been specified as its owners (the people who are responsible for or are impacted by the business issue). You can hover over the image to see a summary of the contact's key details.
- The paperclip icon indicates that files are attached to the card. For example, you can attach sales resources that support the story you're developing about the customer's business, and files containing your research about the customer.
- A green tick icon indicates that the details of this card have been confirmed by key players at the customer's business as being correct and complete. Hover your cursor over the icon to see who confirmed the insight and when.
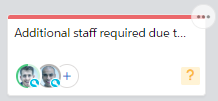
When the icon is yellow, the details of the insight are not yet confirmed by the customer:
Sometimes there can be cards on another map that would be useful on your current map. To import these, click the Import button:

On the displayed dialog, Search Insight Maps, you can add insights from the following maps:
- My Maps: all account, division or opportunity insight maps that you are the owner of.
-
All Maps: all account, division or opportunity insight maps that are published and which you have permission to view.
-
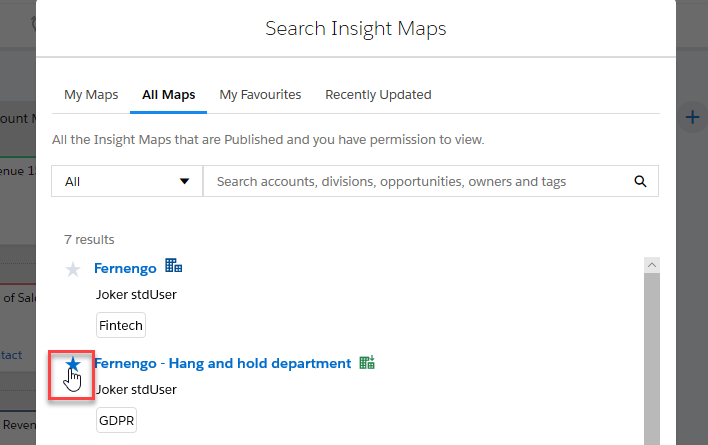
My Favorites: all insight maps that you have marked as a favorite. To mark a map as a favorite, click the star next to the map (as shown below).
-
Recently Updated: all account, division or opportunity insight maps (published or unpublished) that you have recently changed.
On the preview screen, select the insights or sections that you want to import and click Add. You can also mark the import map as a favorite on this screen.
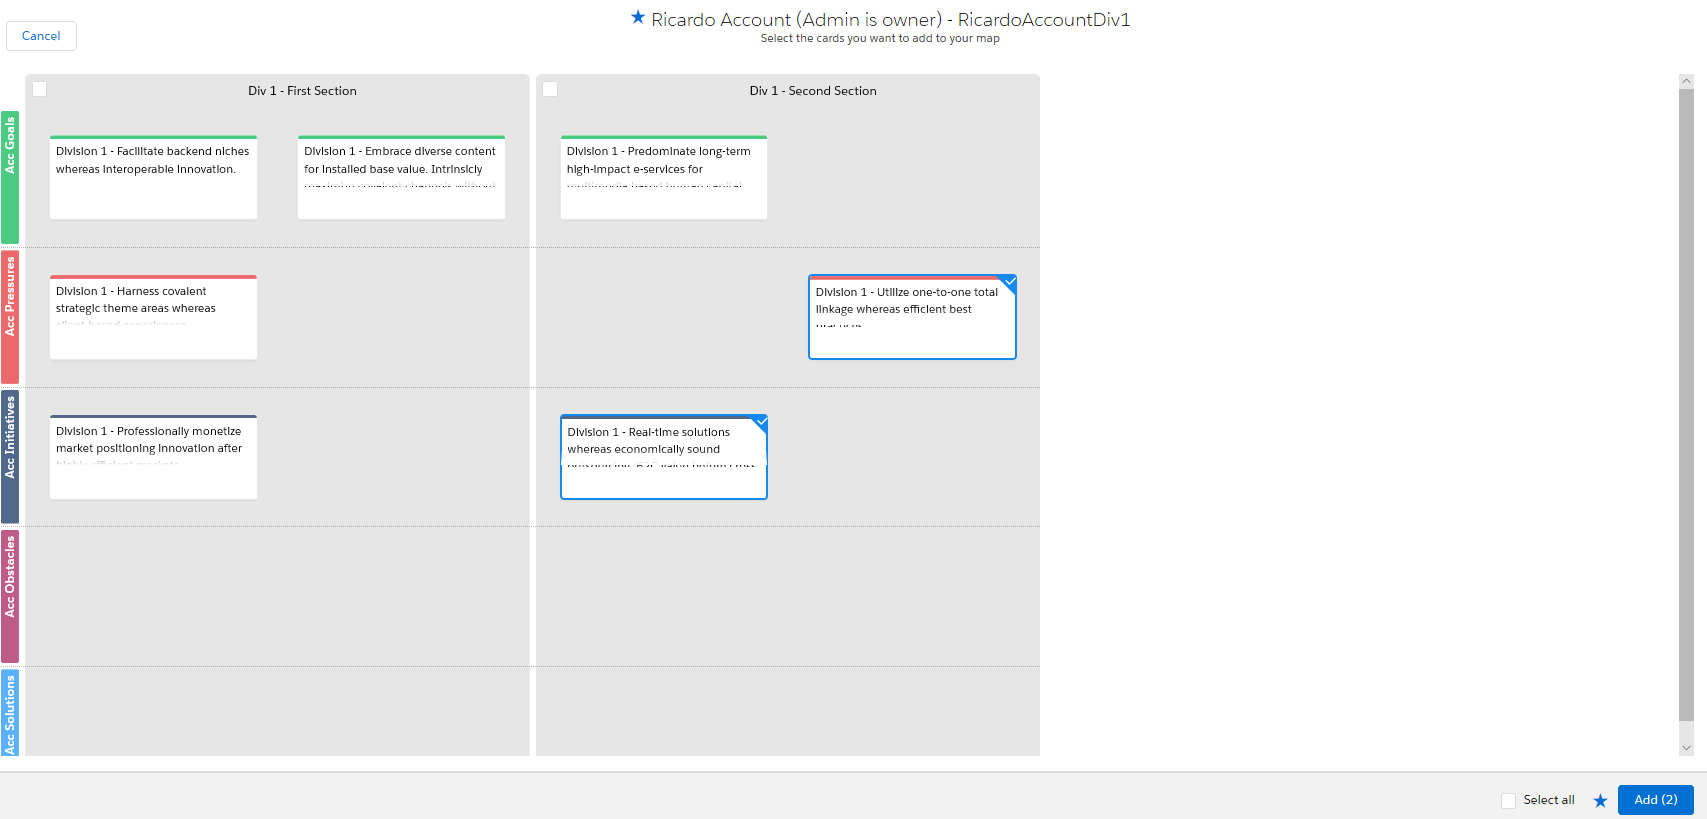
Imported insights are added to the section with the same name on your map. Otherwise, a new section is created on your insight map.
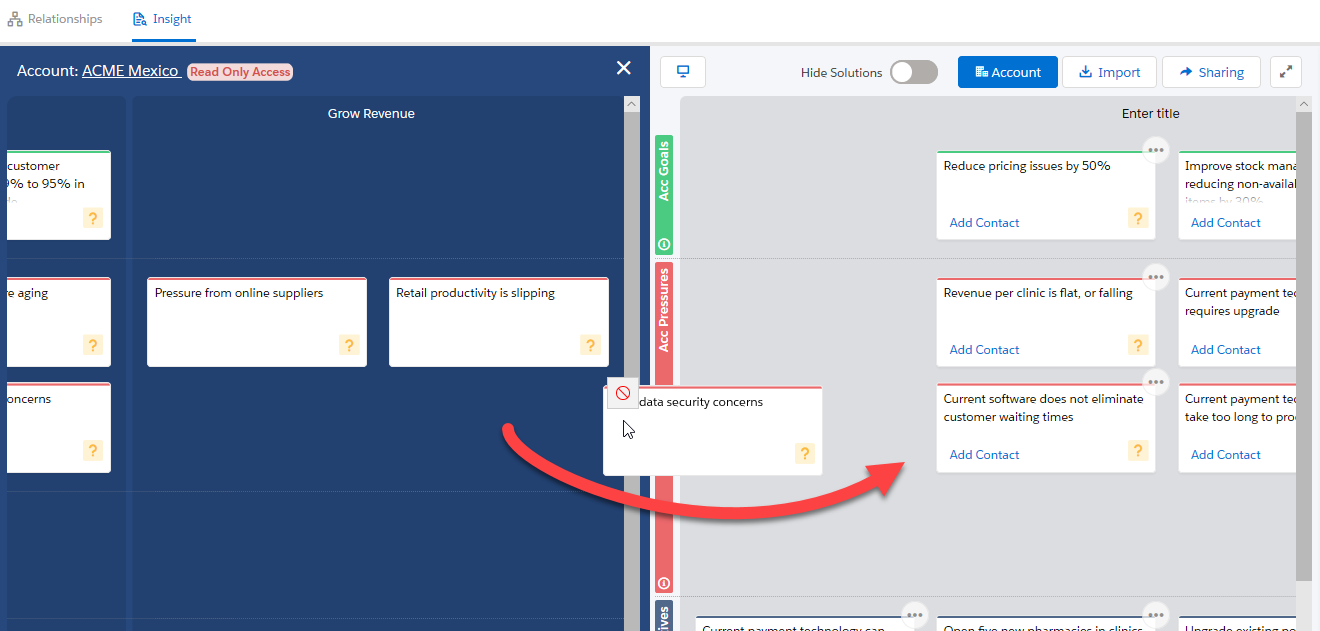
When you're working on an opportunity or account division's insight map, there's a quick way to copy cards from the related account's insight map.
Click the Account button.

This opens the account's insight map in a panel on the left. You can simply drag cards from that board into your opportunity or division's insight map.
You can share your insight map so that colleagues can find and import cards from your map to theirs. This is useful if they are building a map based on a similar industry, region or company type.
To share your map, click the Sharing button (indicated below).

When set to Published, all users that have viewing permissions for the relevant account or opportunity can import your map.
Apply Tags so that your insight map can be easily found. Your administrator configures the tags that can be applied to insight maps.
Click Done to share your published map.
Note: Users with read-only access to the associated account/opportunity cannot add tags to your insight map or publish it.
When you start a new insight map, it has a single section. To add another section, click the Create Section icon and then type the name of the new section.
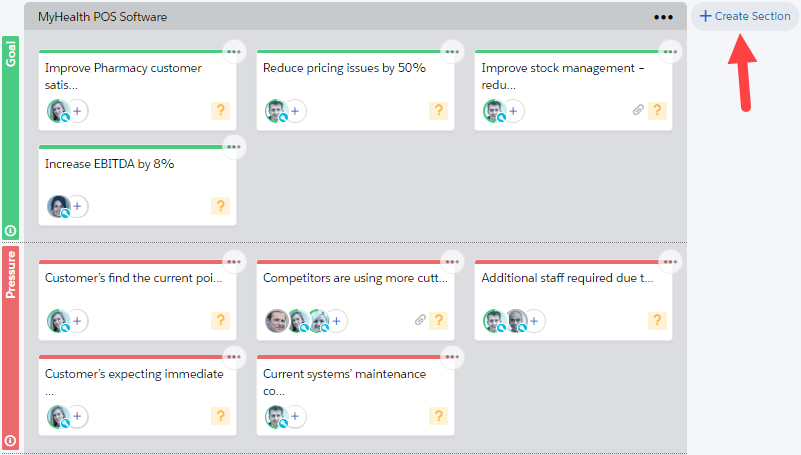
To structure the insights on the insight map into a coherent story about the customer's business issues, you can drag them between sections and layers.
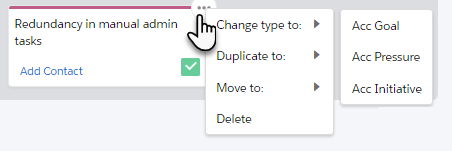
Each insight card also has a power menu that gives you various options. You can:
- Change the insight's type. This moves it to a different layer of the board. (This is an alternative to dragging it.)
- Duplicate an insight to another section. This means the same insight is in more than one section, and a change made to it in one section is reflected in every other section that includes it.
- Move an insight to another section. (This is an alternative to dragging it.)
- Delete an insight. This removes it from the map. If you decide the insight belonged on the map after all, you'll need to create it again.
When you're presenting your insight map to the customer, it can be useful to switch to a slideshow view. This has options that help you to prepare for a presentation to the customer, and then present the insight map to them sequentially, section by section.
Click the view mode icon.
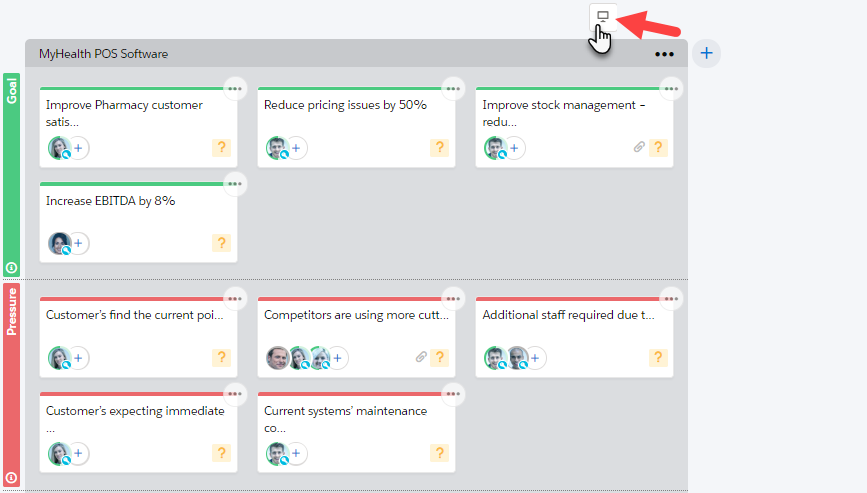
The insight map switches to slideshow mode. You can select either Presentation View or Narrative View.
- Presentation View [1}
- Narrative View [2]
-
You can also print [3] or export a PowerPoint file [4] for the insight map section that is currently displayed.
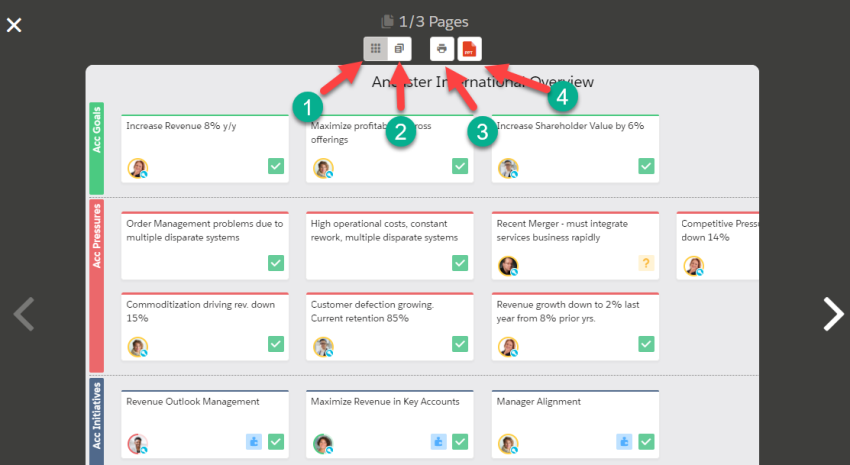
Note: The export option is not available to Altify Insights users.
This enables you to present the board section by section in slideshow format.
This shows you the insight map in text form, which can help you to prepare your talk track for a presentation to the customer.
