Presentation mode
Use the presentation mode to deliver a presentation of the dashboard.
On the dashboard, click See more  and then click Presentation Mode. The dashboard displays in presentation mode.
The following navigation is available:
-
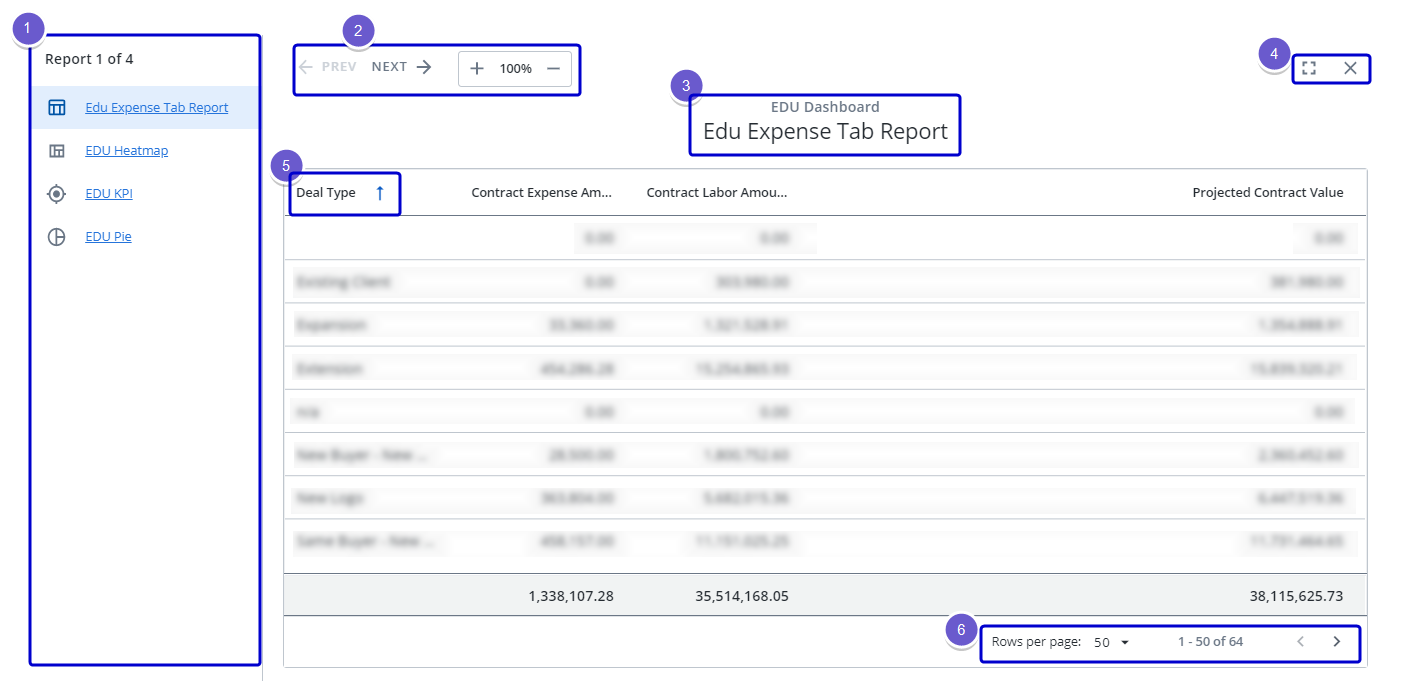
Report List: Displays all of the widgets contained in the dashboard. Note that if your dashboard has multiple tabs, all of the widgets on all of the tabs are displayed. Click the report or graph/chart to display it.
-
Widget Pagination: Displays the previous or next widget in the report list. You can also zoom into or out of the report or graph/chart.
-
Dashboard and Report/Graph/Chart Title: Displays the title of the dashboard and the report or graph/chart.
-
Click
 to display the report or graph/chart in full screen. The report list is hidden and the focus is on the report or graph/chart. Press esc to exit the full screen. Click
  to exit presentation mode. You are returned to the dashboard.
 - Available for reports only, you can sort columns in
 ascending or
  descending order.
 - Available for reports only, when a report has a large number of records, you can choose how many rows of records to display per page and navigate pages.
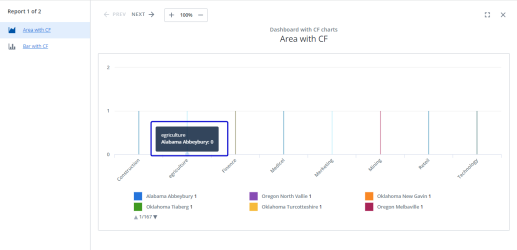
- Available for graphs and charts only, you can hover over elements in a graph or chart to display more information.