Manually Invoking Adapter Crawls
AutoClassifier Cron Schedules are commonly used to crawl content.
-
However, there are manual options that are used to crawl content other than Cron Schedules.
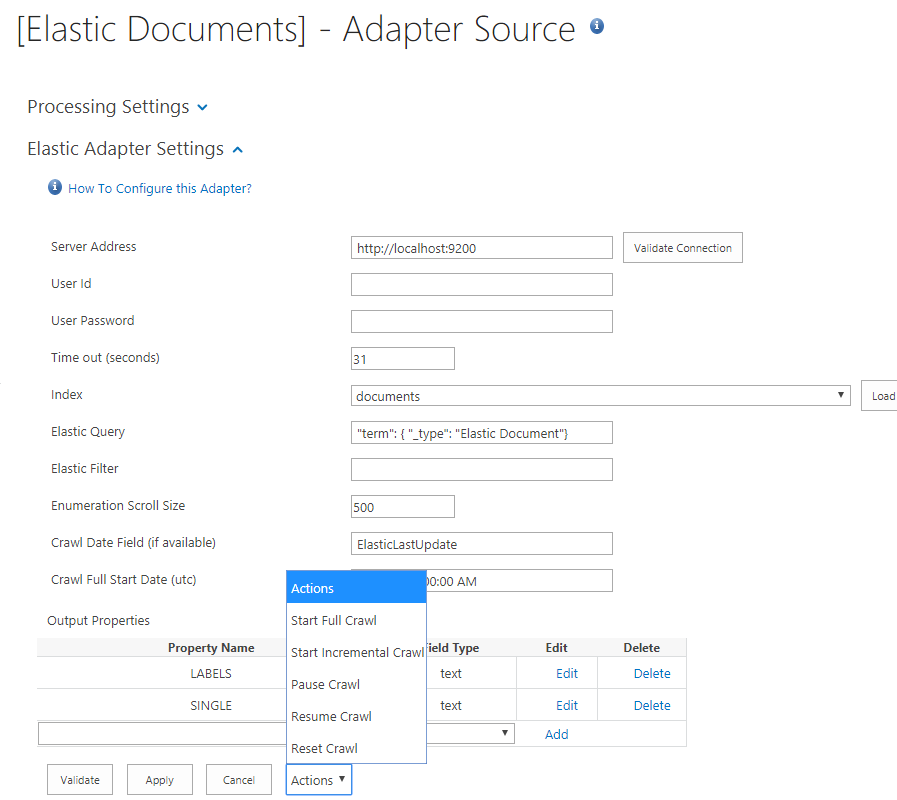
Manual options on "Adapter Source" page:
- Edit any Adapter Source
- Note the Actions Button
Procedure:
Use the following steps to crawl content using manual settings:
- Navigate to your Elastic Documents adapter source.
- Select the Actions drop-down menu from the bottom of the page.
- Select the appropriate option.
- Click Apply.
Note: If the Adapter source is not enabled, only Reset Crawl action is available. - Validate the crawl is completed successfully. See the section below.

Verify Using Crawl Status
After a crawl has been started, you MUST check the status of the crawl.
The information and screens shown below describe how to discover information that you can use to investigate any possible issues the crawl has uncovered.
To verify the crawl status has run successfully, check the Log Detail status.
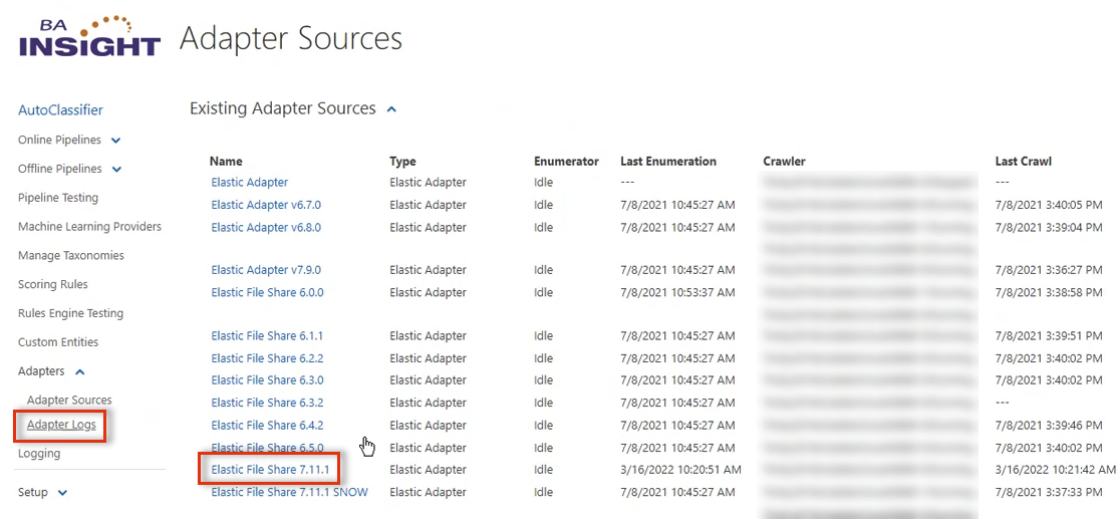
- In AutoClassifier, under Adapters in the left side navigation, select Adapter Logs.

- Select your adapter.
- Elastic File Share 7.11.1 is highlighted in the screenshot above.
- This correlates with the example below.
- Note the last crawl date and time in the far right column.
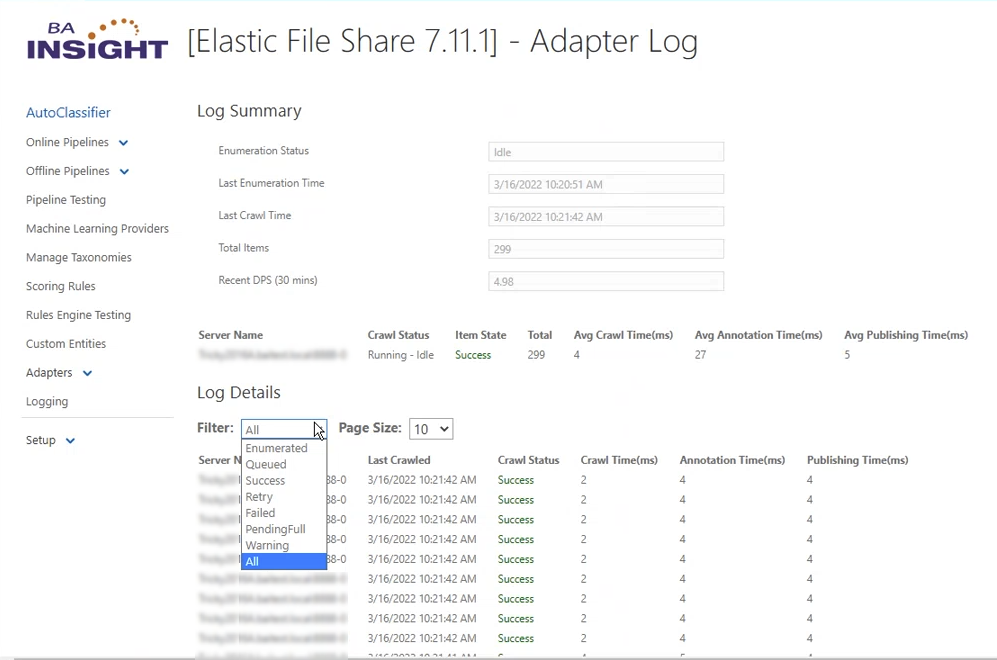
- The Adapter Log page opens. See the example below.
- The Log Details section of the page contains the details of the crawl for this adapter.
- Use the Filter option shown to examine crawl status.
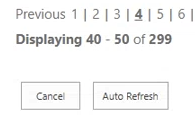
- Click the Auto Refresh button at the bottom of the page to automatically refresh the page every 30 seconds.

Example - Elastic File Share
In the example below, the Elastic File Share adapter is shown.
The column "Server Name" is obscured by the Filter menu.
Adapter Crawl log details include:
- Enumerated
- Queued
- Success
- Retry
- Failed
- PendingFull
- Warning
- All
Example: Elastic File Share
