SmartHub Analytics Prerequisites
SmartHub Analytics Prerequisites
Before installing SmartHub, the following third-party applications, listed below, for SmartHub Analytics must be installed.
Third-Party Applications
- Elasticsearch v7-8.7.1 and earlier (download)
- Kibana v7-8.7.1 (download)
- Configuring Security in Kibana (instructions)
Java Applications
Install either JRE or OpenJDK with Hotspot, if they are not already installed and configured.
Java Runtime 64-bit (JRE)
To run the install operation:
- Download the latest Java JRE (found on the Java or Oracle site).
- Add a new system variable:
JAVA_HOME. - Specify the path to the Java install directory (root of
/lib /bin):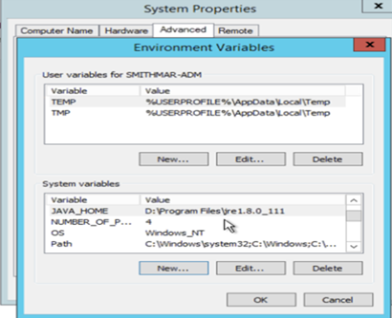
OpenJDK with Hotspot
-
Open-source JDK: AdoptOpenJDK with Hotspot (v11)
-
JAVA HOME: During installation, select the Custom Setup options shown below:
- Specify the path of the JAVA_HOME variable:
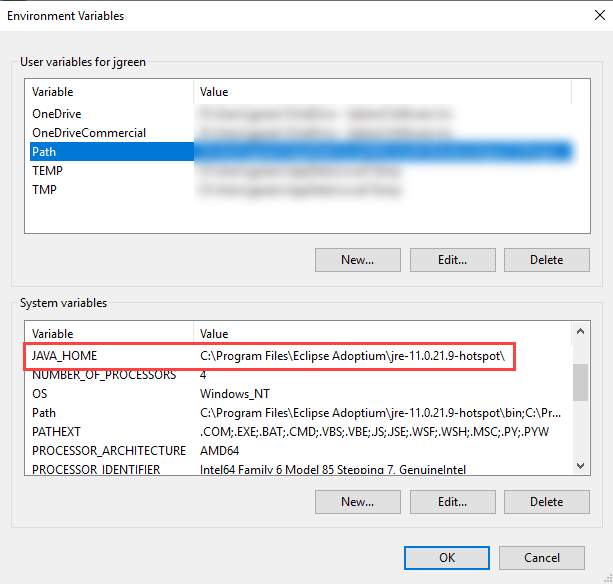
- Specify the path of the JAVA_HOME variable:
Install Elasticsearch
This is the search engine where all the recorded user activity is stored.
- Documentation: To see the Elastic documentation, go to Elasticsearch Documentation.
To run the install operation:
- Go to Elasticsearch Downloads page and download the .msi package of Elasticsearch.
- Follow the steps from the install Elasticsearch page to install Elasticsearch as a Windows service.
- Set the following properties in the YML file
\config\elasticsearch.yml:- network.host: 0.0.0.0
Set the value to one of the following:- An IP address attached to an individual network device such as NIC.
- This IP address must resolve to your elastic server (or a DNS which does).
- Once set, you can only access Elastic through this network interface device.
- 127.0.0.1 to make elastic accessible from this server only by using "localhost"
- 0.0.0.0 to make elastic accessible from any address/IP.
- http.port: 9200: Leave this set at the default value of 9200
- discovery.type: single-node: Set this property if you are using a single server for your elastic instance.
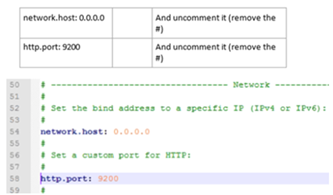
- network.host: 0.0.0.0
- Go to Windows services and start the Elastic service, which is running as a Local System service.
-
Verify the Elastic node status by going to http://localhost:9200.
Note: You must have an instance of Elasticsearch up and running.
Make sure that JSON is loaded.
For example, see the following capture: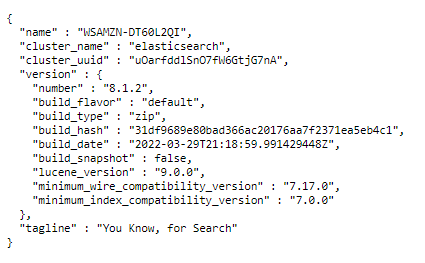
Note: Keep the Elastic window open while you install Kibana.
Kibana
Kibana v7-8.7.1 is the data visualization engine for Elasticsearch.
-
SmartHub Analytics uses reports that are built on top of Elastic Kibana
-
Use the Elastic prerequisites to install Elastic Kibana on the same server or a different server from where you install Microsoft Application Request Routing v3.0 and the SmartHub Analytics Reporting site.
-
For more information, go to the Kibana page.
Procedure:
To install Kibana as a Windows service, follow these steps:
-
Go to the Kibana Download page, download and unzip the file.
-
Go to the NSSM Download page, download and unzip the file.
-
Use the command prompt with administrator permissions to navigate to the folder which contains nssm.exe:
cdpath_to_nssm/nssm-2.24/win64orpath_to_nssm/nssm-2.24/win32 -
Run the command (version 7.0 used, for example purposes):
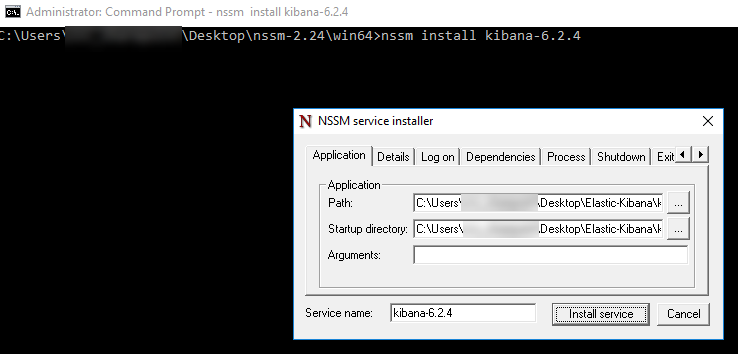
nssm install kibana-7.0.0In the "NSSM service installer" window:
-
Applicationtab: Set kibana.bat as Application Path (screenshot shown for example purposes only)
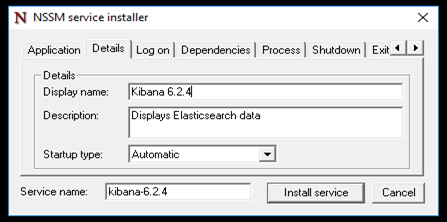
- Detailstab: enter display name, description, startup type
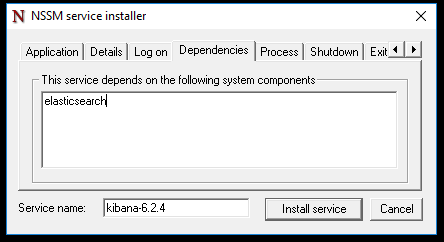
- Dependenciestab: enter Elasticsearch service name
- Click the "Install Service" button.
-
- Update the port, host information, and the Elastic node URL in <path_to_kibana>\config\kibana.yml.
- server.port:
5601 - server.host:
"0.0.0.0" - server.host
:"0.0.0.0"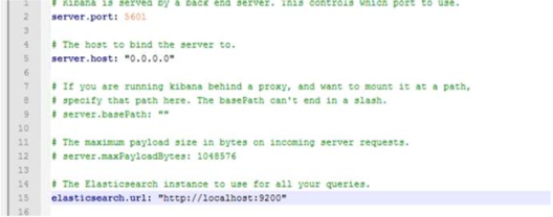
- server.port:
- Go to Windows services and start the Kibana service.
- Verify Kibana by going to http://localhost:5601/
- If you already have Elasticsearch and Elastic Kibana running, or if you have installed either of these applications, you can continue to use these Elasticsearch applications.
This statement is true because SmartHub Analytics creates a new Elasticsearch index.
- Kibana Prerequisites:
In this version of Kibana, use the following additional steps:- Go to your Kibana console and open the Dev Tools tab:http://localhost:5601/app/kibana#/dev_tools/console?_g=()
Run this command:PUT test/_doc/1{}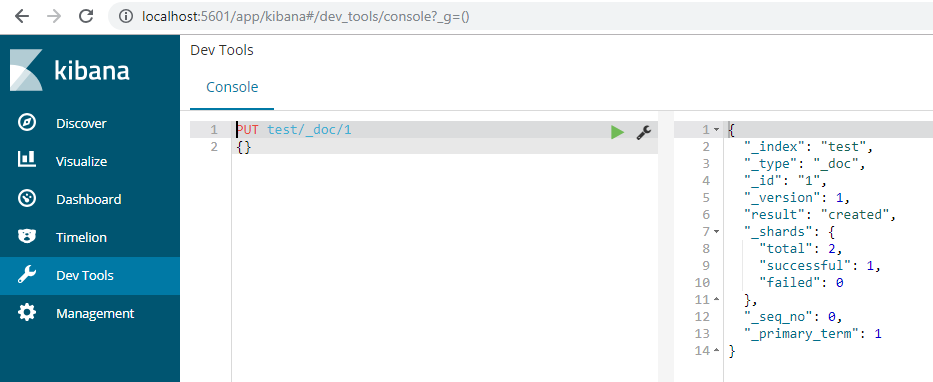
Write "test" in "index pattern" text box.
Click the Next step button.
Click "Create index pattern"

Open the Management tab →Index Patterns.
Create an index pattern based on index:
- Go to your Kibana console and open the Dev Tools tab:http://localhost:5601/app/kibana#/dev_tools/console?_g=()
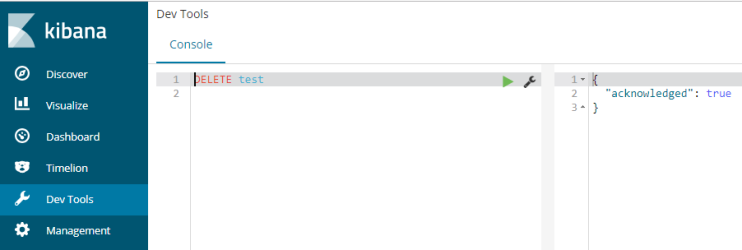
After SmartHub Analytics installation, you can delete the index-pattern and index.
-
Go to Kibana address → Management → Index Pattern → delete the "
test"index pattern.

-
Go to Kibana address → Dev Tools. Write in console "
DELETE test"to delete index.
How to Secure Kibana
-
BA Insight requires Kibana is accessible to end users.
-
We further recommend you secure your Kibana instance.
-
For information on how to do this, see Configuring Security in Kibana.