Configure the Analytics Component
- Overview
- Initialize Kibana
- Configure the Analytics Component
- How to Access the Analytics Reports
- Analytics Settings
- How to Modify the Analytics Settings
Overview
To configure Analytics for SmartHub you perform the following:
- Install all necessary third-party applications
- Complete the SmartHub Analytics prerequisites
- Configure the Analytics Component
Initialize Kibana
Use the following steps to initialize Kibana v8.x:
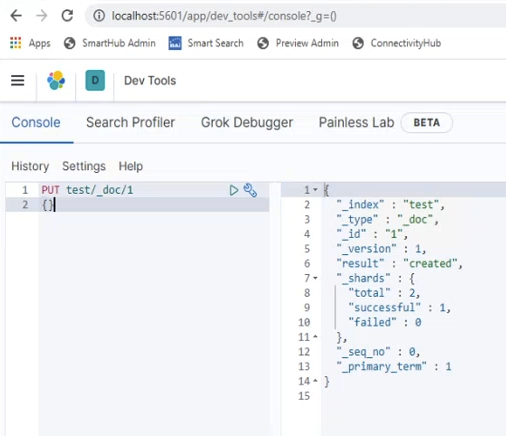
- Go to your Kibana Dev Tools.

- URL (or similar): http://localhost:5601/app/dev_tools#/console?_g=()
- Enter this command and run it:
PUT test/_doc/1
{}
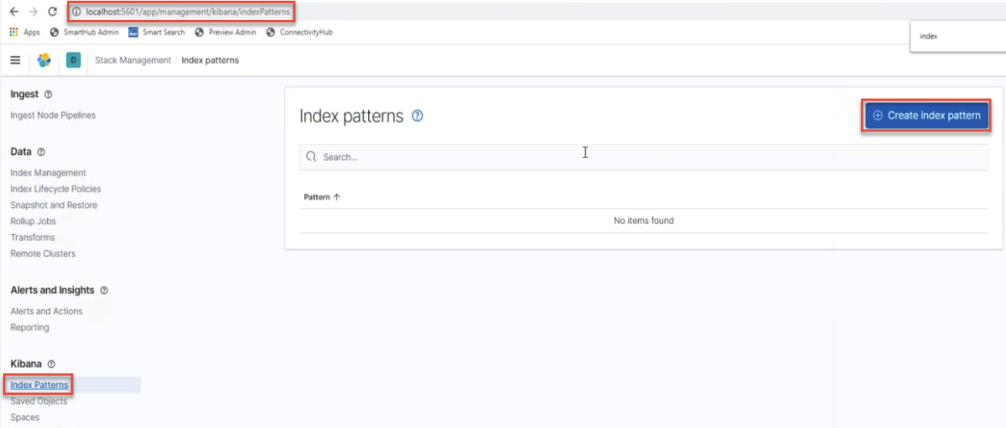
- Open Stack Management → Index Patterns:

- URL: http://localhost:5601/app/management/kibana/indexPatterns
- Create an index pattern based on index:
- Click "Create Index pattern."
- In the Index Pattern text box, enter "test". NOTE: The field is case-sensitive.
- Click the Next step button.
- Click "Create index pattern" .
After you complete the SmartHub Analytics installation, you can delete the index-pattern and index.
- Go to Kibana address > Stack Management > Index Pattern. Delete the
testindex pattern. - Go to Kibana address > Dev Tools.
- Enter into the console "
DELETE test"to delete index.
Configure the Analytics Component
To configure analytics, use the following steps:
- Navigate to the SmartHub Administration page by going to http(s)://[SmartHub-web-app-url]/_admin.
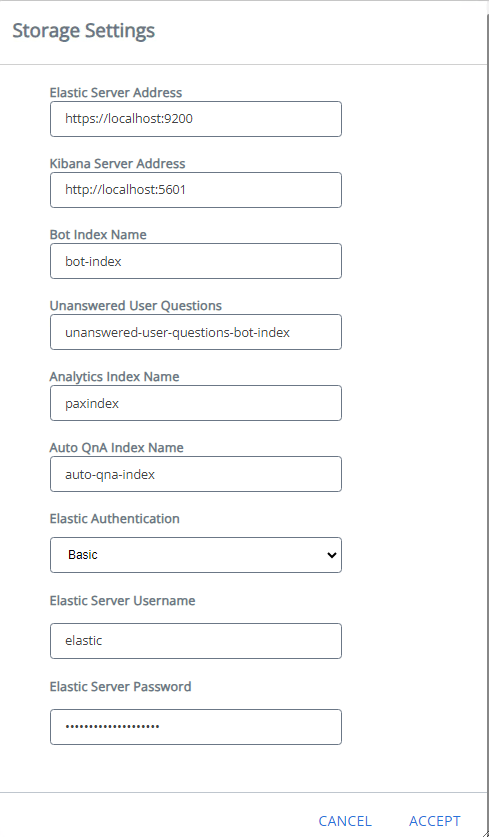
- In the General Settings section, click Edit next to Storage Settings.
- Complete all the following fields:
- Elastic Server Address: This is the URL of your Elasticsearch server, including port number. The default value is http://localhost:9200.
- Kibana Server Address: This is the URL of your Kibana server, including port number. The default value is http://localhost:5601.
- Bot Index Name: This is the name of your bot index. The default name is bot-index.
- Unanswered User Questions index name: This is the name of your unanswered user questions index. The default value is unanswered-user-questions-bot-index.
- Analytics Index Name. This is the name of your analytics index. The default value is paxindex.
- Auto QnA Index Name: This is the name of your auto QnA index. The default value is auto-qna-index.
- Elastic Authentication: Choose and configure the desired authentication mode.
Optional
The Kibana server address, configured during step 3-b, is used when displaying reports to end users.
- Typically, you provide your Kibana service address here, however that address may not be accessible to end users.
- If the Kibana address domain or HTTP settings are different from SmartHub, you may have difficulty displaying the reports in the browser.
As a solution, you may wish to configure Kibana behind a reverse proxy; to do so, see the FAQ "How Do I Configure the Kibana URL for Reporting Behind a Reverse Proxy?"
Optional
When using Kibana and Elastic cloud, you have to add the following setting to the kibana.yml file: xpack.security.sameSiteCookies: "None". For more information, see embedded content authentication.
- Scroll down and click OK to save your changes.
-
From the left-side navigation list, click Analytics Settings.
-
In the newly opened page verify/configure the following:
-
Kibana Configuration Settings:
When you access the page, you will see a message which describes the Kibana configuration status:-
"Kibana is not configured" → This means that the Kibana objects are not imported and the mappings of the Analytics index are not created.
-
The configuration of Kibana is performed upon clicking the "Save Configuration" button.
-
-
"Kibana already configured" → This means that the Kibana objects have already been imported and the Analytics Index mappings have already been created.
-
-
Advanced Settings:
-
Recommended Results Configuration JSON: You can leave this field as it is (default).
-
Query Suggestion Settings Configuration JSON: You can leave this field as it is (default).
Note: These fields can be customized at any time.
-
-
Tools: You can delete items from the Analytics index using the provided tool.
-
Limitations and Other Important Mentions
-
SmartHub Analytics can only be configured with Elasticsearch/Kibana version 8.7.1 and earlier. Elasticsearch/Kibana version 8.8.0 and later is not compatible with SmartHub Analytics.
-
When using Elasticsearch / Kibana 8.6.x, after completing the configuration of the Analytics Component, you need to restart the Kibana service in order for the Analytics reports to be created and displayed.
-
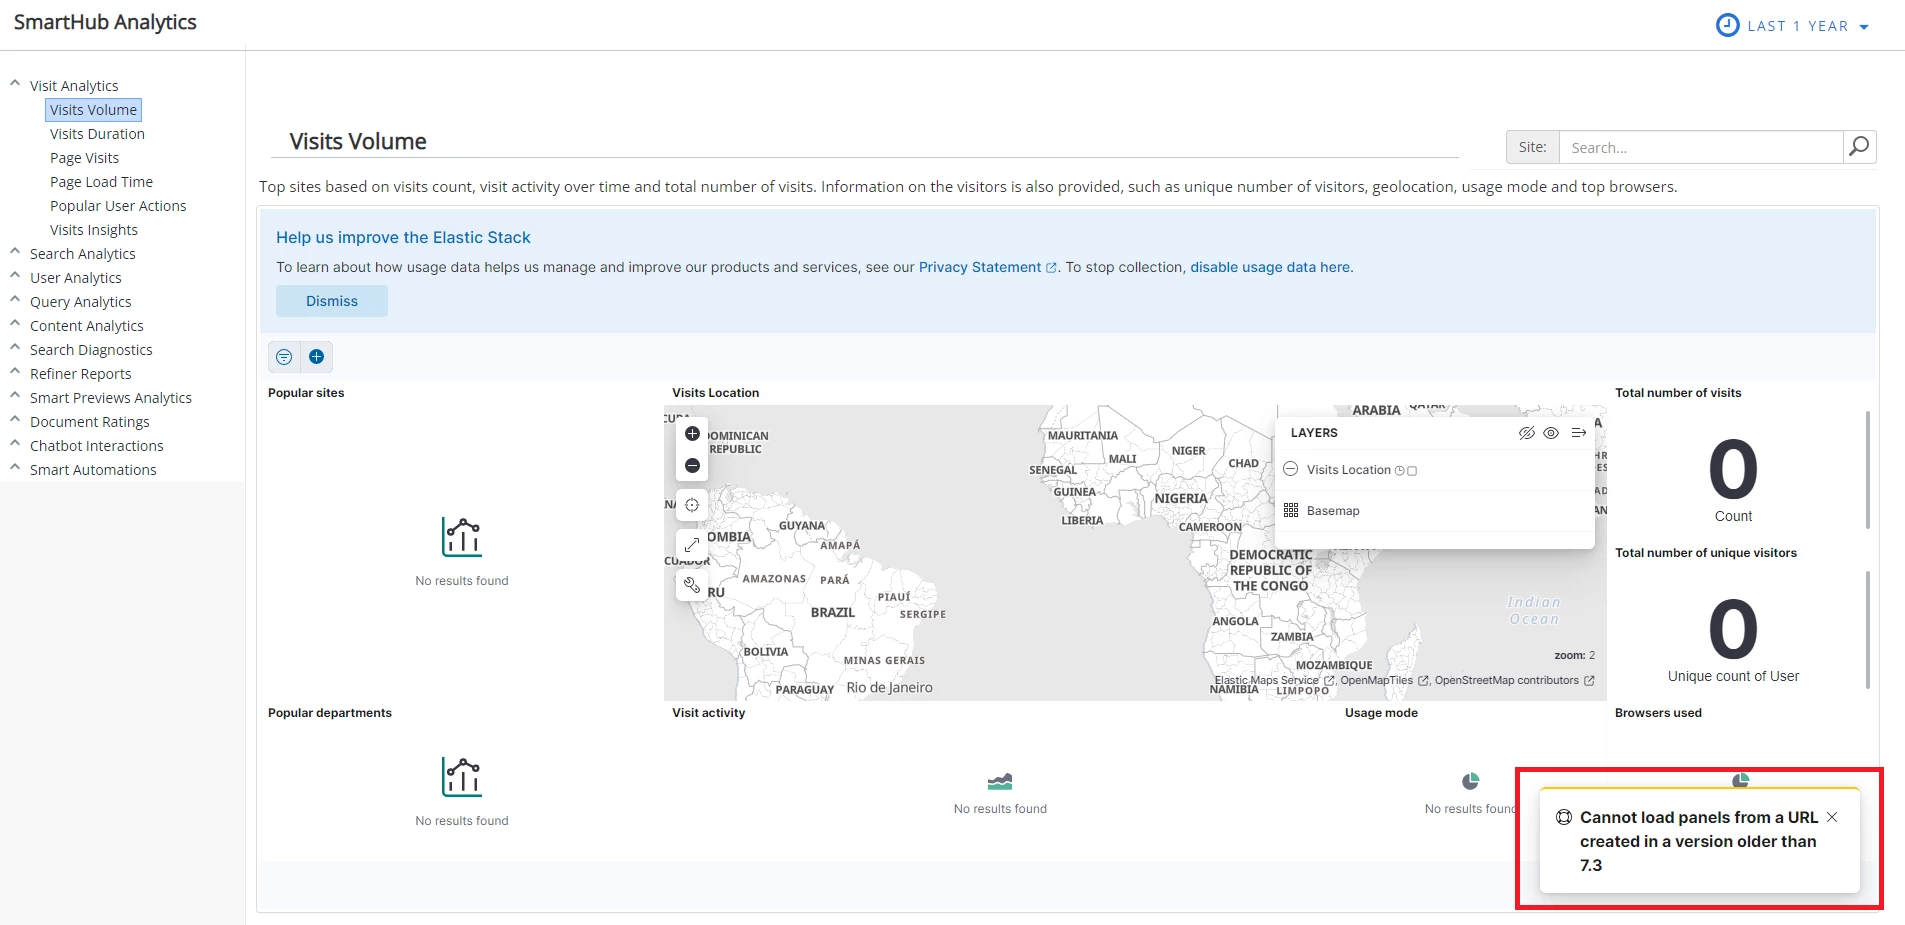
When using a version later than 7.10 of Elasticsearch / Kibana, a "Cannot load panels from a URL created in a version older than 7.3" warning message is displayed in the Analytics reports. The warning message disappears after 10 seconds and doesn't affect the functionality of Analytics.
How to Access the Analytics Reports
To access the Reporting Site, use the following steps:
- Navigate to the SmartHub Administration page by going to http(s)://[web-app-url]/_admin
-
Under the ADMINISTRATION section, click on Analytics Reports.
- A new page with the analytics reports will be opened.
Analytics Settings
| Setting Name | Default Value | Description |
|---|---|---|
| Enabled | true |
|
| PAXModules | "PAX_PortalModule, PAX_SearchModule, PAX_UserProfileModule, PAX_VisualRefinersModule, PAX_SmartPreviewsModule, PAX_Ratings, PAX_ChatBotModule, PAX_SmartAutomationsModule" |
The modules for which actions will be recorded in the analytics index. |
| customProperties | "" |
Custom document metadata that should be recorded for any user action related to a document. For example, OpenItem, PreviewDocument, DocumentRated, etc. |
| showTrackingBehaviorControl | true |
true - The analytics tracking section is displayed in the Personalization menu. false - The analytics tracking section is hidden in the Personalization menu. |
| enableGeolocationTracking | true |
true - The geolocation tracking is enabled. false - The geolocation tracking is disabled. |
| artifactPushInterval | 60 |
The number of seconds after which the actions will be sent to the server to be recorded in the analytics index. Note: In order for actions to be recorded in real time set this setting to 0 seconds.
|
| visitsDuration | 30 | The number of minutes after which a visit ends. |
| geolocationTrackingMessage | "We would like to know your location in order to improve your search experience.".toLocaleString() | The message displayed for geolocation tracking. |
| trackingBehaviorPropertyName | "BAISmartHubAnalyticsTrackingBehavior" | The property name for tracking behavior. |
| defaultTrackingBehavior | "0" |
|
| trackingControlFile | "client/pax-tracking-behavior-control" |
The path to the trackingControl JavaScript file. Note: Must have the format used by require.js
|
| recommendedResultsControl: showRecommendedResultsDropdown | false |
true - The dropdown list for recommended results is displayed. false - The dropdown list for recommended results is hidden. |
| recommendedResultsControl: enableRecommendedResultsControl | true |
True - The recommended results control is enabled False - The recommended results control is disabled |
| recommendedResultsControl: title | "Filter results by".toLocaleString() | The label of the recommended results dropdown list. |
| recommendedResultsControl: messageNotFoundRecommededResults | "Could not find any results for option: ".toLocaleString() | The message displayed when no results are found for recommended results. |
| recommendedResultsControl: items |
Copy
|
The list of drop-down options for recommended results. The "value" parameter for each item must correspond with an option of Recommended Results Configuration JSON from the Analytics Settings section in the SmartHub administration site. |
| recommendedResultsControl: parentSelector | ".coveo-results-header" | The JQuery selector for parent element(s) where to inject the control. |
| UserProfileMappings |
Copy
|
The mappings of the properties for user profile. The original user profile provider properties are on the left and the desired labels on the right. |
| enableCaseSensitivity | "false" |
true - Case sensitivity is enabled for user queries. false - Case sensitivity is disabled for user queries. |
| logLevel | "WARN" |
The browser console log level for the Analytics module. The possible values are INFO, DEBUG, WARN, ERROR, and OFF. |
How to Modify the Analytics Settings
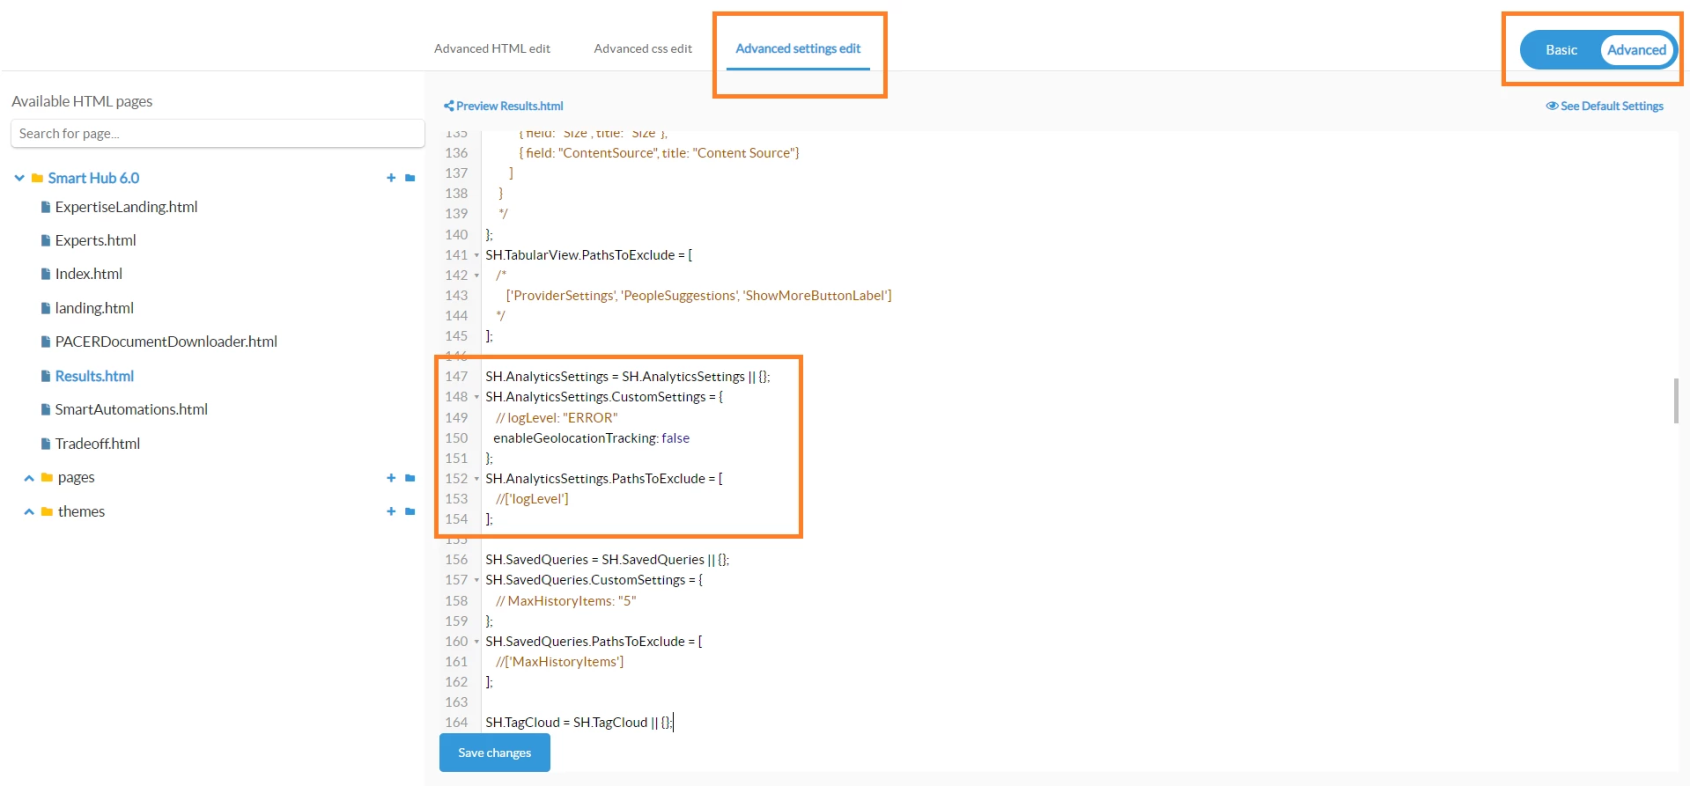
To modify the analytics settings, you need to access the UI Builder. For more information, see How to Use the UI Builder.
-
Select the page that youwant to add/modify the analytics settings for.
-
Select the Advanced mode.
-
Select the Advanced settings edit tab.
-
Locate the analytics settings section around line 147.
-
Add/Modify your setting(s) under the SH.AnalyticsSettings.CustomSettings block.
Note: When clicking on the See Default Settings button from the upper right corner, a new tab opens that displays all the default settings for the SmartHub modules.Locate the analytics settings section to see the default values that are used to control how analytics behaves on your web page.
-
Save changes.
In the example below, a custom setting is added to disable the GeolocationTracking option.
