View Numeric Query Results in a Chart View
About
-
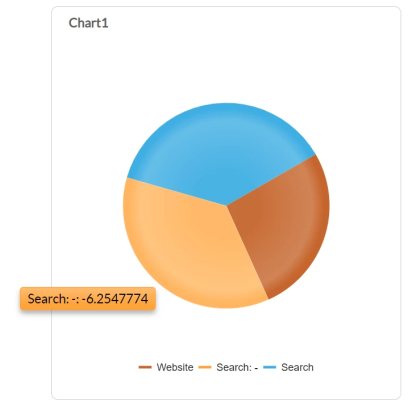
The ChartView component is used to display SmartHub results as a chart.
-
See the image below.
How to Activate ChartView
UI Editor
The easiest and fastest way to work with the Ribbon component is via the SmartHub UI Editor.
-
Log in to the SmartHub Administration page as an admin.
-
Click the UI Editor link from the left-side navigation.
-
Click the Select a page link from the top menu.
-
Select (double-click) a custom Results.html page to modify it.
-
BA Insight recommends you create your own custom page (within its own folder) to modify. Leave the default files as templates.
-
Example: Customizations/CustomResultsPage.html
-
-
- Click the Advanced link at the top right of the window to enter Advanced mode.
-
Select the Advanced settings edit link at the top center of the page.
-
Go to the custom settings for the ContentContainer that you wish to render as a ChartView. This is where you will insert your ChartView settings.
-
To access the available ChartView settings, click the See Default Settings link in the top right corner.
-
A new browser tab opens with all available SmartHub module settings.
-
Search for the word "ChartView" on the page to quickly navigate to the ChartView default settings:
- By default, ChartView is disabled
- The value "
Enabled" is set to "false"
    SH.ChartView = SH.ChartView || {};
    SH.ChartView.DefaultSettings = {
        Enabled: false,
        "Chart1": {
            legend: {
                visible: true,
                /* #= category # represents the categoryField and  #= value #" represents field from series definition*/
                template: "#= category #",
                position: "bottom"
            },
            seriesDefaults: {
                labels: {
                    visible: true,
                    position: "center",
                    background: "transparent",
                    template: "#= category #: #= value #",
                }
            },
            seriesColors: ["#C5652C", "#FFA338", "#3eaee2", "#FFE198", "#9BC3A3"],
            series: [
                {
                    type: "pie",
                    startAngle: 150,
                    /* this should be a numeric field as it represents the chart value */
                    field: "Rank",
                    /*this represents the chart label value*/
                    categoryField: "title"
                }
            ],
            tooltip: {
                visible: true,
                template: "#= category #: #= value #"
            }
        }
} -
-
Copy all of code from this view.
-
Past the code into the open settings file in the Advanced settings editor in your previous browser tab.
-
Modify the code as you desire:
-
Change the value of
Enabledtotrue -
Change
SH.ChartView.DefaultSettings = {toSH.ChartView.CustomSettings = { -
Change
Chart1to the name of the content container that is used to display results. By default, this isMainResults. -
MainResultsis the ContentContainer that's in the middle of the HTML page and is responsible for displaying query results -
Change (add if missing) the attribute
DefferredRenderingtotrue.
-
-
When you are done, click Save changes at the bottom of the screen.
Ensure the ContentContainer is configured to show on the page.
ChartView Settings Example
-
Use the ChartView code below, which contains two charts, "Chart1" and "Chart2," as an example.
SH.ChartView = SH.ChartView || {};
SH.ChartView.CustomSettings = {
    Enabled: true,
    "Chart1": {
        chartArea: {
            margin: {
                left:5,
                right:5,
                bottom:15
            }
        },
        legend: {
            visible: true,
            /* #= category # represents the categoryField and  #= value #" represents field from series definition*/
            template: "#= category #",
            position: "bottom"
        },
        seriesDefaults: {
            labels: {
                visible: false,
                position: "center",
                background: "transparent",
                template: "#= category #: #= value #",
            }
        },
        seriesColors: ["#C5652C", "#FFA338", "#3eaee2", "#FFE198", "#9BC3A3"],
        series: [
            {
            type: "pie",
            startAngle: 150,
            /* this should be a numeric field as it represents the chart value */
            field: "Rank",
            /*this represents the chart label value*/
            categoryField: "title"
            }
        ],
        tooltip: {
            visible: true,
            template: "#= category #: #= value #"
        }
    },
    "Chart2": {
        chartArea: {
            margin: {
                left: 5,
                right: 5,
                bottom: 15
            }
        },
        legend: {
            visible: true,
            position: "bottom"
        },
        seriesDefaults: {
            labels: {
                visible: false,
                position: "insideBase",
                background: "transparent",
                template: "#= category #",
            }
        },
        series: [
            {
                type: "column",
                field: "Rank",
                categoryField: "title",
                color:"#192930"
            }, {
                type: "column",
                field: "Rank",
                categoryField: "title",
                color: "#33606B"
            }
        ], categoryAxis: {
            axisCrossingValue: [0, 5],
            minorGridLines: {
                visible: true
            },
            majorGridLines: {
                visible: true
            }
        },
        valueAxis: [
            {
                title: {
                    text: "Rank"
                },
                majorUnit: 10,
                line: {
                    visible: true
                }
            }
        ],
        tooltip: {
            visible: true,
            template: "#= category #: #= value #"        }
    }

};
SH.ChartView.PathsToExclude = [];Note: The ChartView settings are built on the KendoChart settings.