Venn Diagrams give a colorful, graphical representation of the way data interrelates and are useful in segmentation of data, e.g. when creating target groups for campaigns or behavioral trends.
Up to five Domains, defined on the basis of individual selections, can be used in a Venn Diagram and each is represented by a colored ellipse. Intersections are shown in a different color.
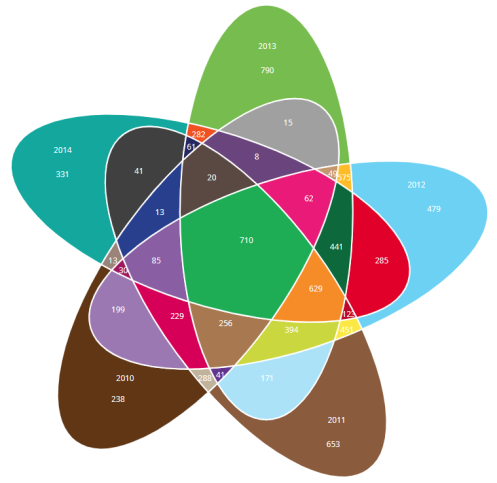
Engage includes two options for creating a Venn diagram:
-
Create a Venn diagram using a behavior periods wizard to define sets.
-
Create a Venn diagram by manually defining data sets.
Using the behavior periods wizard
The behavior periods wizard segments Individuals based on the time periods and criteria selected, e.g. transactions in the last three years.
-
Click on the Create (+) icon in the Navigation Pane and select Venn --> Venn behavior periods from the menu.
-
The first page is a description of the wizard. Click Next to go the Time Periods screen.

Time periods can be absolute, e.g. a Venn with elements going back three years from a given year, which you specify on the next screen, or relative, i.e. always calculated relative to the current date.
-
Adjust the Time Periods settings as required and click Next.
-
Set the Table for the data you wish to include in the Venn, e.g. Individual.
-
Select the date field you wish to use in calculations, e.g. Transaction Date.
-
Add any filters you require and click Next.
-
Give the Venn a name and, if required, a Description then click Finish to see the finished Venn Diagram.
Viewing a Venn diagram
The following Venn diagram is an example created using the behavior periods wizard to view transactions made in the calendar years 2018-2020 as part of an end of year report.
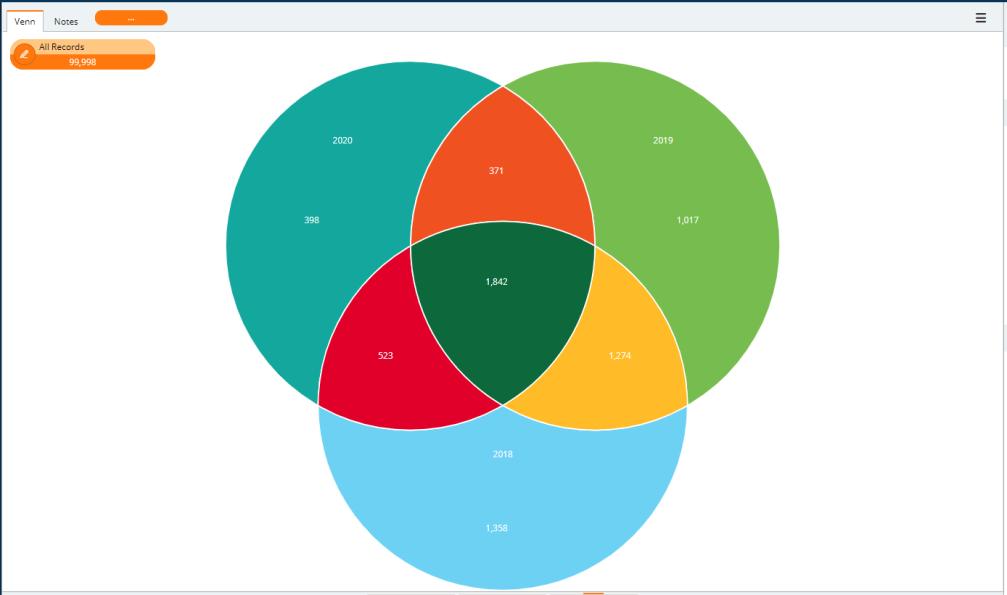
Each circle represents the year in which an individual made a transaction with the overlaps indicating individuals who purchased in multiple years. From this, you can identify that there are 1,358 individuals who have not made a transaction since 2018, there are 371 individuals who made transactions in 2019 and 2020, and 1,842 customers who made transactions in all three years.
To further interrogate a segment of the Venn diagram, right-click on the segment to open a list of options.
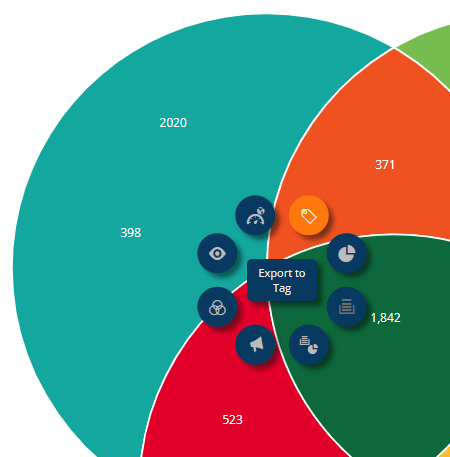
Working clockwise, the options are:
-
Export to Tag - Links any records in the selected Venn to a Tag.
-
Remove Set - This will delete the segment on which you clicked.
-
Show Percent - By default, records in the Venn Diagram are shown as a number. This option lets you display them as a percentage of the whole.
-
Show Count - If you have selected Show Percent, this option lets you switch back to numbers.
-
Show Count and Percent - This option shows count and percent at the same time.
-
New Campaign Audience - This option will open a new Campaign with the selected records as the Audience.
-
New Venn - Opens a new Venn Diagram and adds the selected records as a segment.
-
New Selection - Saves the selected records as a Selection.