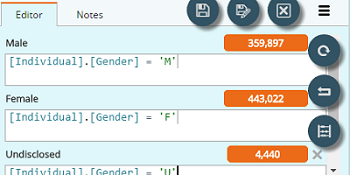
Bandings allow you to create your own custom results groups in Engage, e.g. creating a customized view of another field in the system, or creating new sets of data based on multiple fields. Unlike a query or a field template, custom bandings will appear within your database, rather than in your analysis section.
-
Date bandings allow you to group your data based on date values, e.g. group transaction history by month or year.
-
Numeric bandings allow you to manipulate and segment numeric fields, e.g. grouping customers into age brackets.
-
Parametric bandings allow you to define the criteria for each potential returned value, e.g. band 1 equals all gold rewards customers in the database, band 2 equals all males in the database, etc.
Note: bands are mutually exclusive and calculated in the order they are declared unless you allow overlaps. This means that, for example, a parametric banding that:
-
Selects all gold members in band 1,
-
Selects all silver members for band 2,
-
Groups all males into band 3,
-
And groups all females into band 4,
Would result in an empty band 4 if all customers identified as female in the database are also gold or silver members. With overlaps allowed, female silver members would appear in both band 2 and band 4.
If you need to edit an existing banding:
-
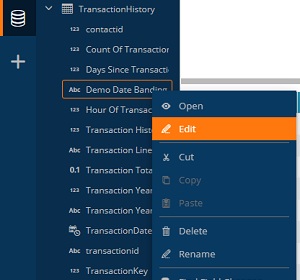
Locate the banding within the database view.
-
Right click on the banding name.
-
Select the edit option from the dropdown menu to open the banding editor pane.
To create a new banding:
-
Click the create (+) icon in the navigation pane and select the banding type.
-
Select the database table you wish to build on, e.g. if grouping individuals by age bracket, you may wish to select your customer table.
-
Set the criteria for your banding, i.e. numeric, parametric, or date specific settings.
-
Open the hamburger menu and save your banding to commit it to the database.
Date banding settings
-
Source field - sets the field to use for your banding, e.g. transaction date.
-
Date banding function - determines how your data is grouped, e.g. if you wish to group your data based on transactions by month, you could select month profile or month interval.
Note: month profile does not account for the year, e.g. transactions in January 2019 will be grouped with transactions in January 2020. If you wish to break your data into months but account for year, e.g. January 2019 would be a different division to January 2020, use month interval.
-
Date range and divisions - defines the period to cover. How you do this depends on your banding function, e.g. for month profile you would define which months to include (1-12) and how many divisions to create, whereas month interval will require a start date and end date.
-
Additional properties - In the properties pane you can define:
-
Which fields to show as part of your banding.
-
If syntax fields are to appear and where.
-
Numeric banding settings
-
Source field - sets the field to use for your banding, e.g. age.
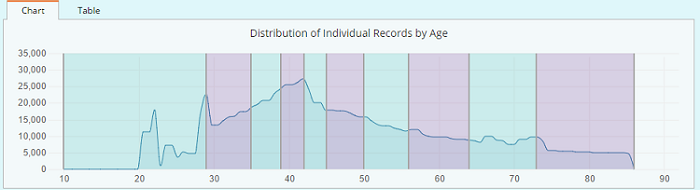
When you select a field, Engage will chart your data.
-
The vertical axis shows the count of database matches, e.g. number of people.
-
The horizontal axis displays the data in the field, e.g. individual's age.
-
-
Divisions - defines how many times Engage splits your data, e.g. if you enter 3 into the textbox, the data will be split into thirds. If you type 10, the data will be split 10 ways.


Note: by default, divisions are created with an equal width and could result in decimal steps, e.g. 10.00-17.60. To force the divisions to integer steps, e.g. 10-18, tick the integer bounds checkbox.
-
Lower and upper values - tells the system the start and end values of your data range.
By default, Engage will use the largest and smallest integer values available. To alter the range, untick the use field min/max boxes, and type in the integer values you would like to begin and end with, e.g. exclude customers under the age of 21.
-
Grouping - defines how to allocate data to divisions.
-
Group by value - divides the difference between the upper and lower values by the number of divisions to create equal width divisions, e.g. 21-30, 31-40, 41-50, etc. (rounding to the nearest integer if integer bounds is ticked).
-
Group by count - ensures each of your divisions has an equal count of individuals. Division widths will change depending on how each bracket is represented within the database.
Example: data with a large representation of individuals between the age of 30-55 and a low volume of individuals at the range extremes (10-29 and 73-86) results in narrow divisions where representation is high to ensure equal counts per division.
-
Manual grouping - lets you create your own divisions by clicking on any of the separation lines and dragging them to a new location.
Tip: selecting the table tab will allow you to type in your divisions.
Note: selecting the table tab displays the data as a table. You can also rename each division on the table tab.
-
Parametric banding settings
-
Allow overlaps - allows entries to appear in more than one band. By default, entries only appear in the first band they match.
Example: band 1 selects anyone with a gender of male and band 2 selects anyone with an age of 35.
If allow overlaps is unticked:
-
Anyone who is Male will fall into Band 1.
-
Remaining individuals in the database, e.g. all female, non-binary, and undisclosed entries, who are 35 will fall into band 2.
If allow overlaps is ticked:
-
Anyone who is male will fall into band 1.
-
Anyone who is 35 years old will fall into band 2.
-
Anyone who is male and 35 years old will be in both bands.
-
-
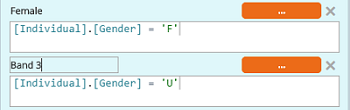
Band criteria - defines how to group your data.
-
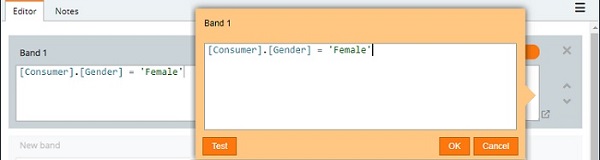
Enter criteria by typing into the text box or dragging-and-dropping fields from your database.
-
Continue to add bands by selecting the new band box (grayed out until clicked) and entering criteria.
-
Note: If you make an error, you can delete a banding by clicking the X in the top right corner next to each banding count.
Tip: you can rename a band by clicking on the name, and typing in a new name.
-
-
Band counts (defaults to ... when first setting up the bands) - displays the number of entities in each band. When you are done adding bands, open the hamburger menu and select the count icon to generate a count.