Upland BlueVenn's Engage platform uses an Analytical Data Server (ADS) as its data source for marketing analysis and campaigns. The Data menu provides tools to apply ADS changes to Engage, search your data, and drag fields into analysis and campaign elements.
Click the data stack icon in the navigation pane to expand the data menu and view your tables.
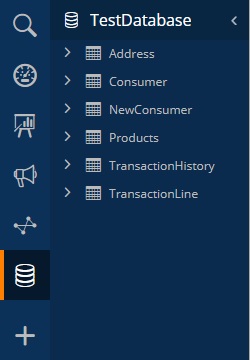
Clicking a table's dropdown arrow allows you to view the fields contained within that table. In Engage, you see everything that is wholly contained within the ADS:
- Bandings
- Queries
- Virtual Fields
- Indexed Objects
Data Types
-
Boolean - Holds values that can be only True or False.
-
Currency - The system of money used by a given country.
-
DateTime - A point in time, typically expressed as a date and/or time of day.
-
Decimal - A fraction written in the form of a dot followed by one or more numbers, e.g. 1.00.
-
Geographic - Postal or zip code based data type used for distance calculation and mapping data.
-
Integer - A positive or negative whole number, or zero.
-
Text - Any written material including letters, numbers and characters also used to define a literal value when contained in quotation marks.
Apply ADS changes to the Engage database
During initial configuration, Engage is connected to the organization’s ADS. Engage will pull through all fields (real and virtual), queries, bandings and indexed objects. When the data in these elements changes, Engage pulls the updated information automatically.
If a new element is added to the ADS, that element does not come through automatically. To pull changes into Engage:
-
Click on the Data icon in the navigation pane to expand the menu.
-
Right click on the database name and select Find Database Changes... from the dropdown menu. Engage will advise the number of changes to be made.
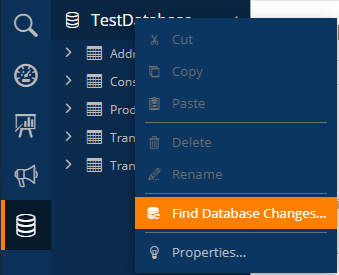
The number of changes found will reflect all users connected to the Engage server, not just for the user who clicks OK.
The database changes made are:
-
New ADS elements are added to Engage.
-
Items deleted from the ADS are deleted from Engage.
-
-
Click OK to confirm the changes.
Search for Data
You can either browse the database by expanding the tables within the Data menu or use the search function to look for fields.

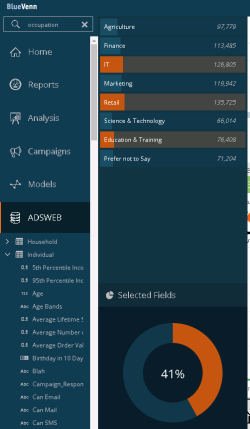
Selecting a field will show the discrete values available on this field and the volumes of individuals who fall under each Band. These volumes are displayed as populated bar charts to show how the volumes compare to one another. You can use these fields and bands to conduct analysis or build audiences for campaigns.
Adding Fields to an element
-
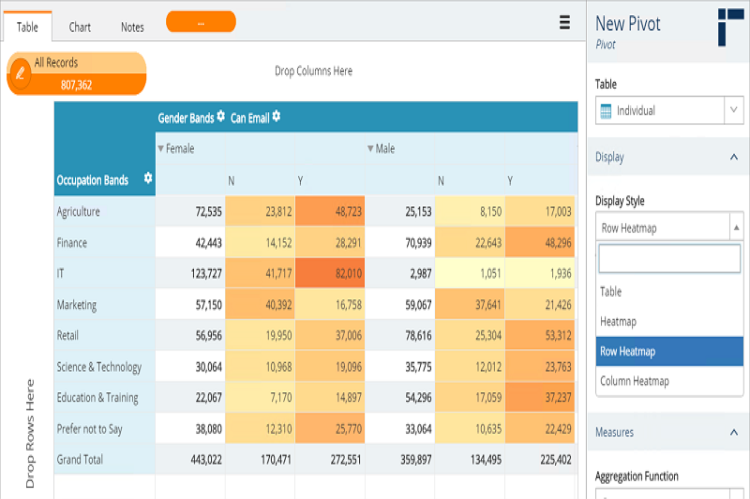
Open or create the element you wish to drag the data into, e.g. Create a Pivot.
-
Select the bands you wish to use within your selection, Venn diagram, etc. Selected items turn orange. The Percentage pie chart at the bottom will also change to show what percentage of your data has been selected.
-
Drag and drop the data as required by the Engage element to use it within that element, e.g. Pivot tables have drop zones for rows and columns.
-
Continue dragging fields as required. Refer to articles for individual elements for more details on creating pivots, Venn diagrams, field lists, etc.