Your Manager Dashboard displays information on the services, costs, usage, trends, and rule violations associated with the employees, teams, or departments you manage.
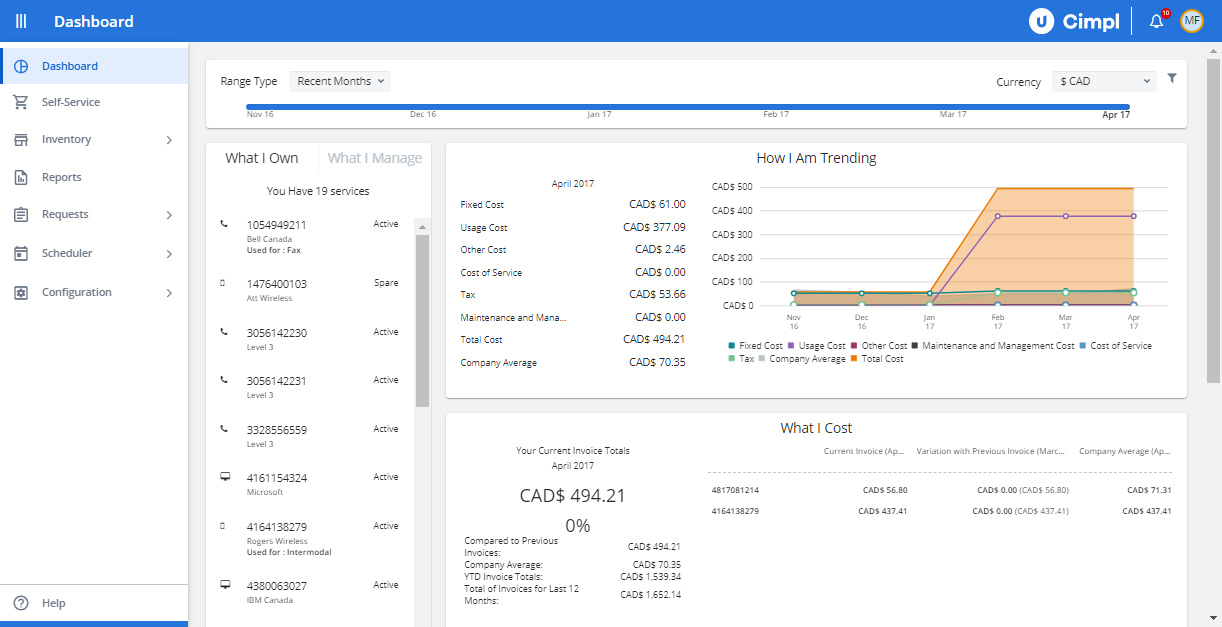
Example of Cimpl's manager dashboard. Click to enlarge.
The widgets available to you are:
Timeline
The Timeline in the dashboard is a way adjusting the time frame for the data to be displayed. The data appearing in previous months' allows you to know who had what, what it was, how much it cost and where it was in the previous months. Cimpl achieves this by using a concept called "Point-in-Time".
The Timeline allows you to choose one of three types of time windows:
- Recent months.
- Calendar year.
-
Fiscal year.
Note: To set your fiscal year, see Modify fiscal year.
To select one of the three types:
- Click Range Type drop-down.
- Select:
- Calendar Year
- Fiscal Year
- Recent Months
- If you select Recent Months, click the arrows on either side of the Timeline. Cimpl will adjust the data in all widgets automatically.
- Click on a month to view the corresponding monthly data.

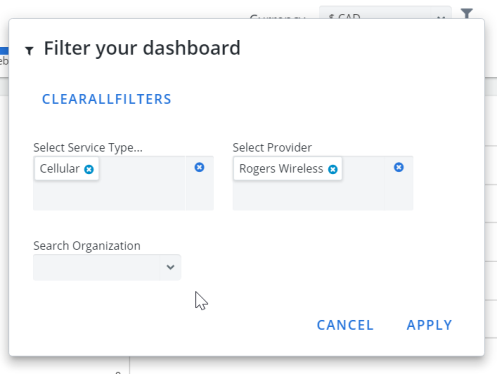
Filter your Dashboard
You can also add filters to your dashboard to adjust the data displayed.
- Click the filter icon on the Timeline.
- Click Select Service Type. A drop down opens.
- Select the Service Type.
- Click Select Provider. A drop down opens.
- Select the Provider.
- Click Apply. The Dashboard updates with the filters applied.
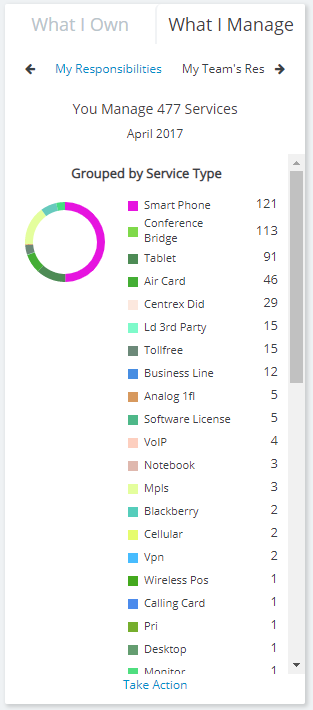
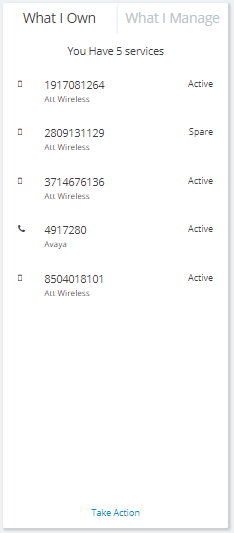
What I Manage
See the status of services for which you are responsible, including all of the services associated with the employees, teams, and departments you may manage.
You can view the summary of all your services, your team's services, or your department's services, all grouped by service type and provider.
By default, the Manager Dashboard shows summary data for your own services What I own.
Click on What I manage to view:
- My Responsibilities lists all services, including your own, under your responsibility. You can also change the data displayed in the rest of the dashboard to show either the summary data for services belonging to your team or to your department.
- My Team's Responsibilities displays all services in your team, not including your own.
- My Department's Responsibilities displays all services in the department for which you are responsible, not including your own.
Clicking Take Action will redirect you the toward the Self-Service module, where you can take action on services shown in the dashboard.
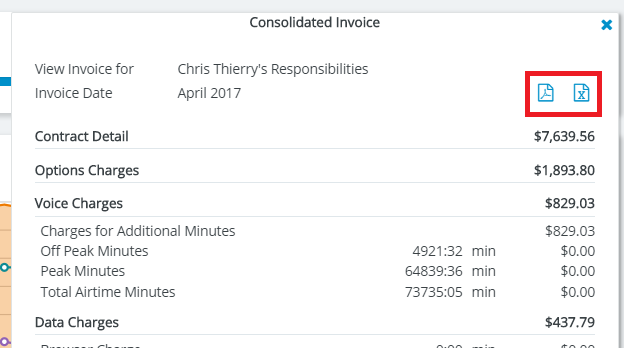
You can view a consolidated invoice for the team or department.
To view and export the consolidated invoice:
- Click View Team's/Department's Consolidated Invoice. The invoice window opens on right side of screen.
- Click the PDF or Excel icon to export the data.
What I Own
The What I Own widget shows the summary of the costs incurred for your services. It also shows you the difference between the current month's costs and those of the previous month.
- See the current monthly invoice total and previous month’s delta.
- See a summary of the previous 12 months’ invoices, YTD invoices, and company average.
- See invoice breakdowns by service, along with comparisons to previous month’s values and the company’s average.
- Click on each service to see the information visualized on the dashboard.
How I Am Trending
The How I Am Trending widget shows you all your cost and usage trends over the span of the last 12 months (or any other time period for which there is data). The data can be adjusted using the timeline. Because you have manager permissions in Cimpl, you can see the cost and usage trends associated with the employees you manage as well.
Be aware of the cost and usage trends associated with you and the employees, teams, and departments you may manage.
- You can see the current month’s Recurrent costs, Usage costs, Other costs, Service costs, Maintenance and Management costs, Taxes, Total costs, and Company average.
- You'll also see the 12-month trend for all these values in a graph.
- You can see these trends for other time periods by adjusting the time frame via the interactive timeline.
- A legend is located below the graph; it lets you "turn off" graph elements by clicking them in the legend; this way you can view trends on a more granular level.

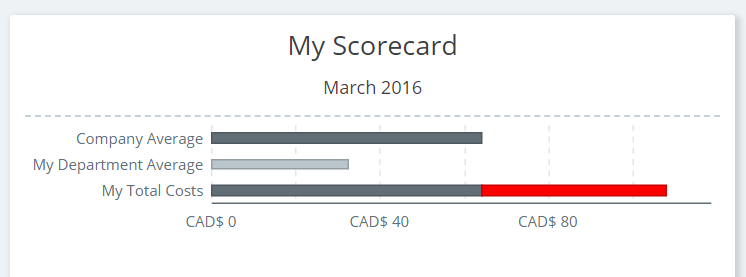
My Scorecard
The My Scorecard widget shows you a comparison of your usage of services against those of your department average and company average.
A quick color-coded view of your current monthly compliance with your company’s usage rules and allowances.
- Green: Compliance.
- Yellow: Approaching defined limits.
- Red: Limits have been exceeded (i.e. assigned rule has been broken).
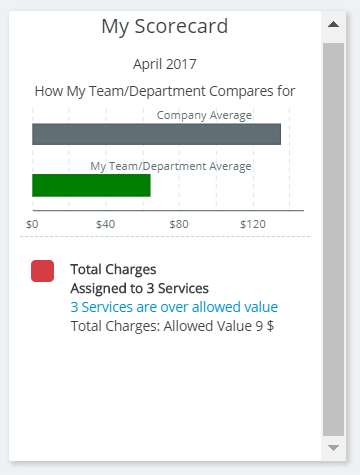
If you are looking at the What I Manage data, the My Scorecard widget updates to show how your team compares to company averages.
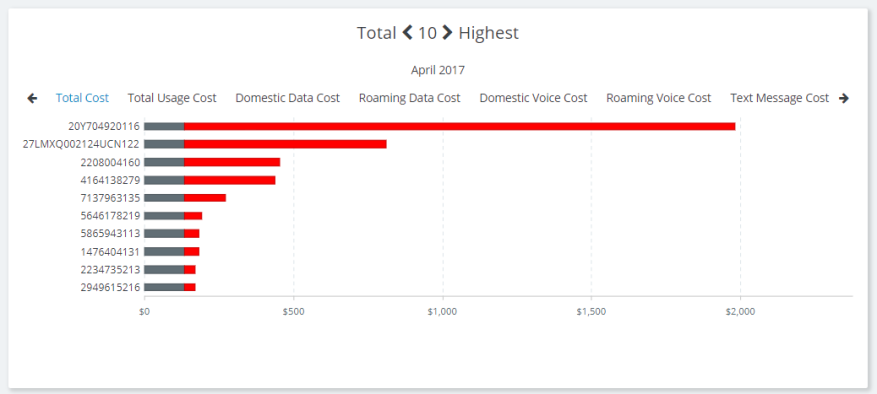
Total Highest
The Total Highest widget shows you a list of the services that have incurred the greatest cost for the month. It allows you to quickly identify the costliest users and services in your team or department.
The widget displays Total 10 Highest whether you are in My Responsibilities or My Team's Responsibilities or My Department.
You can adjust the number of users and services by clicking on the arrow characters (i.e., the < or >) in the pane title. The range is from 5 to 25.
This data is presented in panes that each display a graph of:
- The services with the highest monthly total cost for the month for the 3 different views.
- The company average against which each of these services are compared: red indicates the services' usage costs are over the company average.
- Hovering over a line shows a pop-up of the user's name, usage charges and the company charges.
You can change the display from Total Costs to: "Total Usage Cost", "Domestic Data Cost", "Roaming Data Cost", "Domestic Voice Cost", "Roaming Voice Cost", "Text Message Cost", or "Long Distance Cost" by clicking on the headers.
What I Used
The What I Used widget shows a summary of your usage type for the selected month. The widget also displays the monthly summary of the usage by your employees (depending on what you manage).
You can see a summary of your total usage of:
- Voice services: domestic, roaming and long distance.
- Data services: domestic and roaming.
- Text messaging services: domestic and roaming.
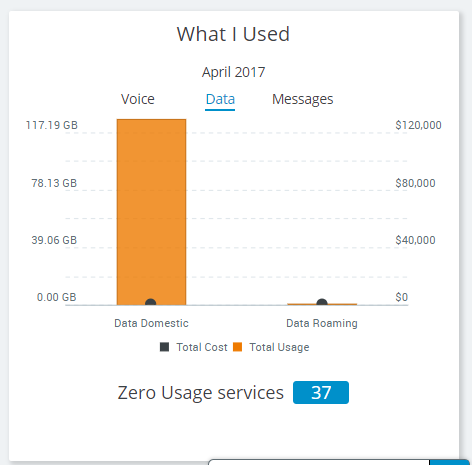
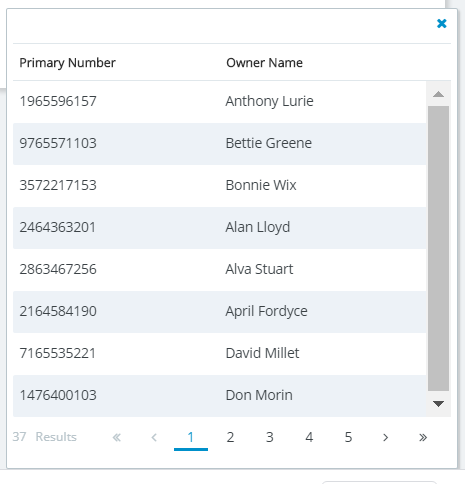
As a manager, you can also see a summary of the zero usage services under your responsibility.
- Click the number beside Zero Usage Services. A pop-up with a list of the zero-usage services opens, along with the assignment name.