Your Reports Center is the module that produces comprehensive reports on inventory, invoices, employee details, and other useful information about your IT and telecom assets.
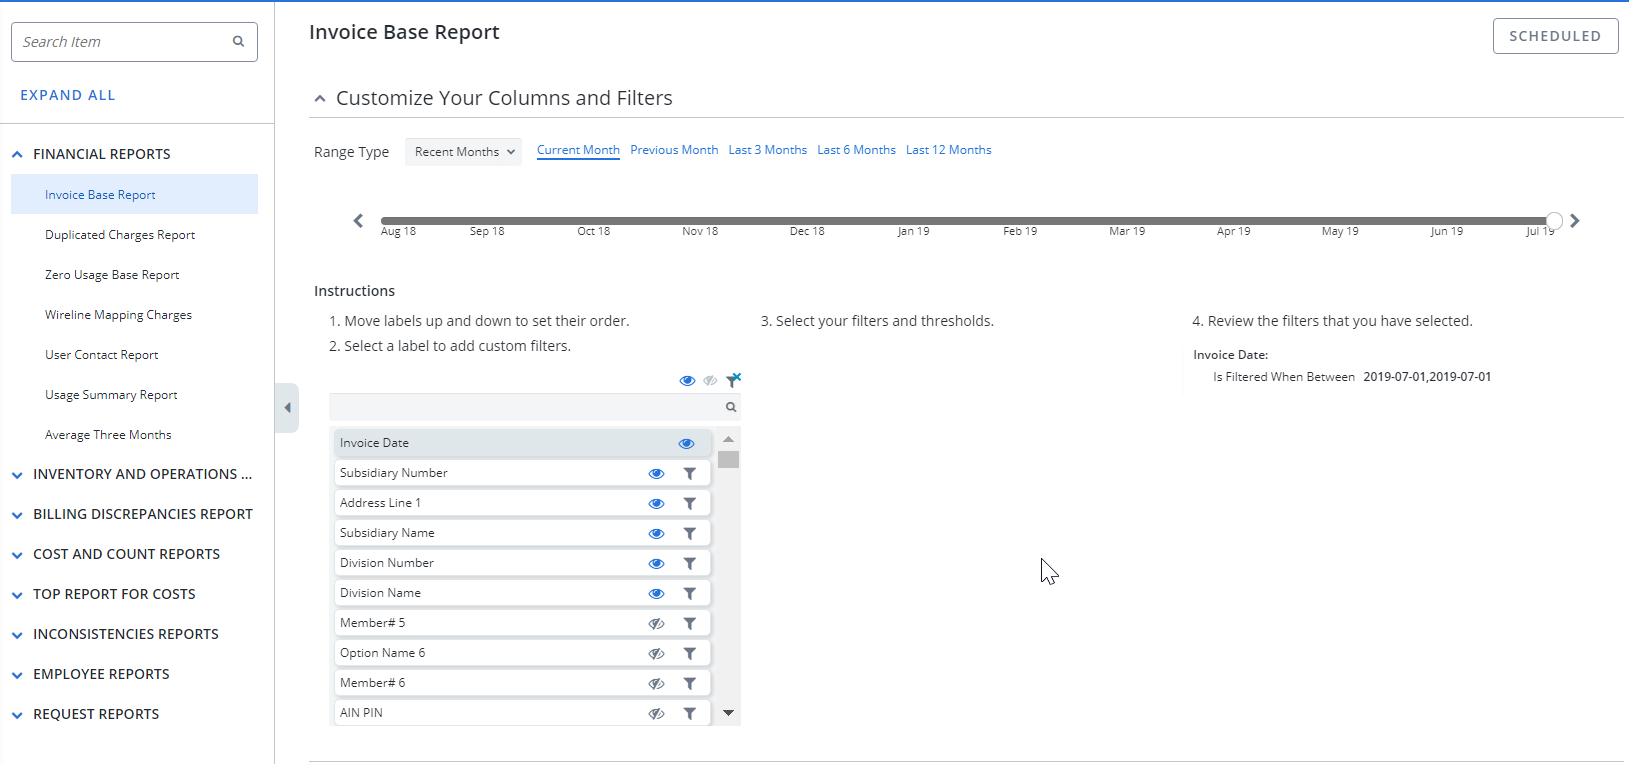
Example of the Reports Center. Click to enlarge.
The Reports Center allows you to:
- View, export or delete the reports that you created.
- Add or remove report columns and filters.
- Create graphs and charts to help visualize your data in reports.
- Schedule reports to be sent out to specific users on an ongoing or one-time basis.
In the left-hand Reports Menu pane, you'll see the six categories of report types that you can create. It's also where you'll see the list of reports that you've created and saved.
You can:
- Search
- Expand or collapse sections
-
Hide or show the whole menu
Example of the Reports menu . Click to play.
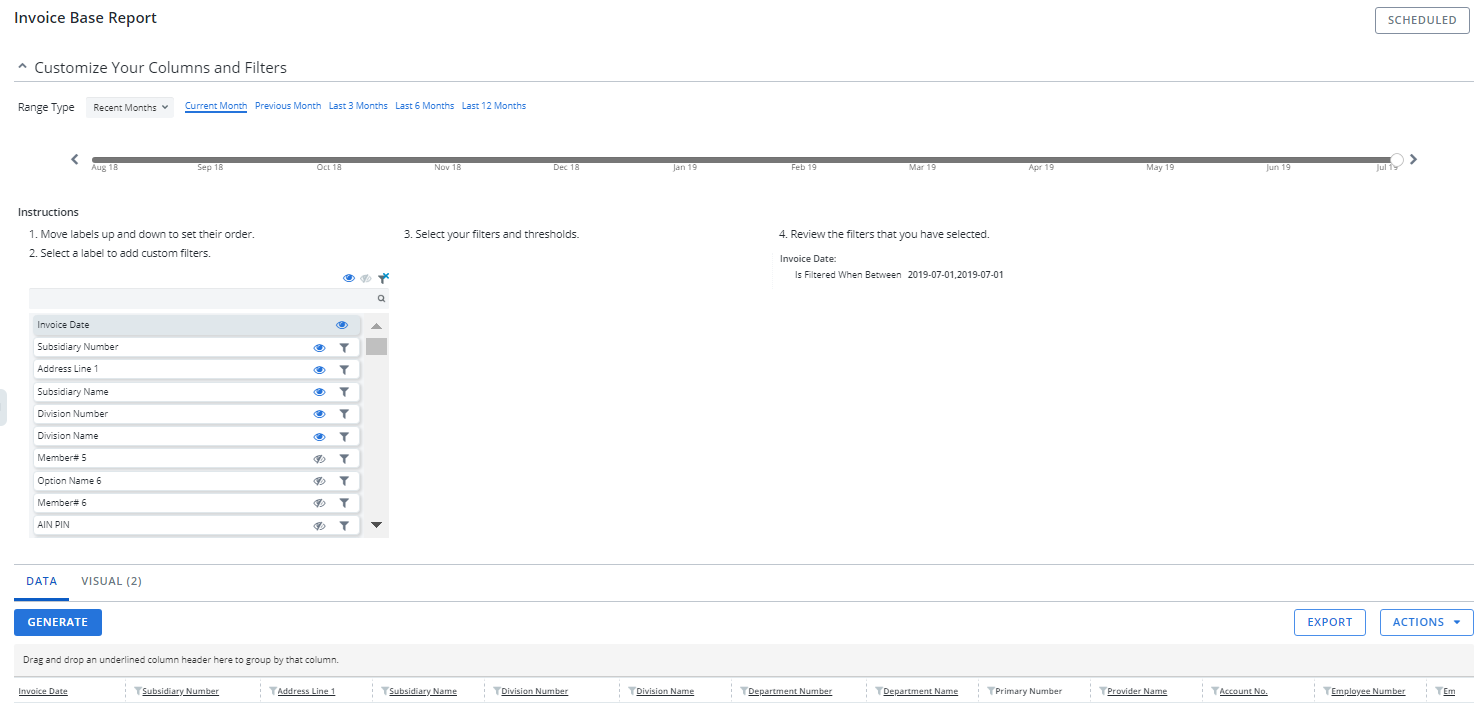
In the right-hand Action pane you'll see a few elements that are standard to nearly all report types in the Reports Center:
- An interactive sliding timeline and configurable data filters for your report's parameters.
- A Data tab where you can work with and group report columns.
-
A Visual tab where you can create graphs (this tab is unavailable for some reports).
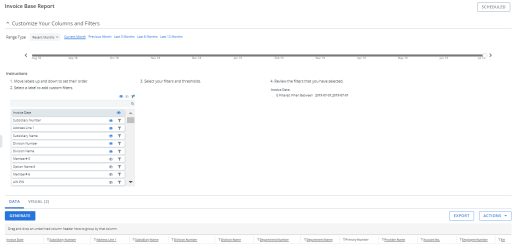
Example of the Reports Action Pane. Click to Enlarge.
Base vs. Live-base Reports
Cimpl allows you to produce 'base' reports, and 'live base' reports.
- A 'base' report pulls data as of the last invoice loaded.
-
A 'live base' report pulls the data as of the last second before you click “generate” (thus “live”).
Tip: If you see a timeline on the top of the screen for the report you are on, it is a "base" report. The timeline allows you to product a report at a point-in-time (i.e. selecting the month). Each month the point-in-time information for service assignments and hierarchy is burned when the invoice is loaded.
Point-in-Time
To allow historical reporting, Cimpl has implemented a concept called Point-in-Time. In Cimpl, any time there is a timeline, such as in the Reports section, it means that you can go back to a point-in-time.
Point-in-Time (also known as PiT) is a concept where data is burned at a specific point. In Cimpl, each month upon invoice load (or loads if you have more than one provider), the following data is "burnt":
- Service inventory.
- Invoice (costs, usage).
- Employee or Department assignment.
- Hardware (model, serial #).
When reporting historically, this allows you to know exactly:
- Who had What.
- What it Is.
- How much it costs.
- Where it is.
For more on how data is "burnt" in Cimpl see Invoice loads and data in Cimpl.
The reports you have access to depends on your role and permissions setup on Cimpl. Each category of reports can be configured for each individual profile.
| Report Type | MACD & Administrator | Manager | Employee |
|---|---|---|---|
| Employee Reports |

|
|
|
| Top Report for Costs |
|
|
|
| Financial Reports |
|
||
| Inventory and Operations Report |
|
||
| Billing Discrepancy |
|
||
| Cost and Count Reports |
|
||
| Inconsistency Reports |
|
||
| Request Reports |
|