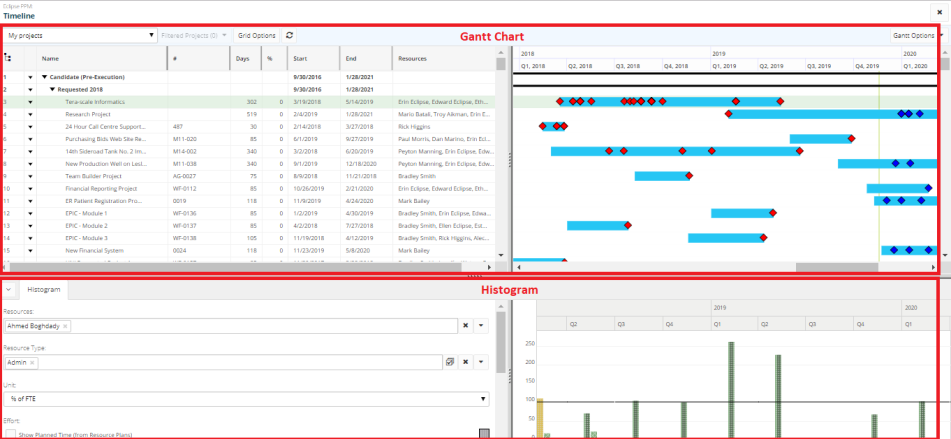
Timeline Overview
The Timeline page displays 2 charts: a Gantt Chart and a Histogram. These 2 charts are among the most useful and commonly used graphical representations in the project management field. By having these two graphical displays on the same page, Eclipse users can take quick and accurate decisions regarding the allocation of resources in project work plans.

Through the next 2 articles, you will be able to know
- The type of data each chart represents
- How to manage the displayed data on each chart