Automation reporting widgets
Note: This feature is only available for Enterprise and Workflow licenses. See FileBound licensing for more information.
The following automation reporting widgets are available in FileBound:
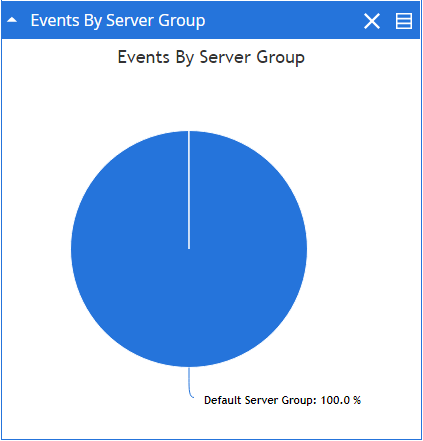
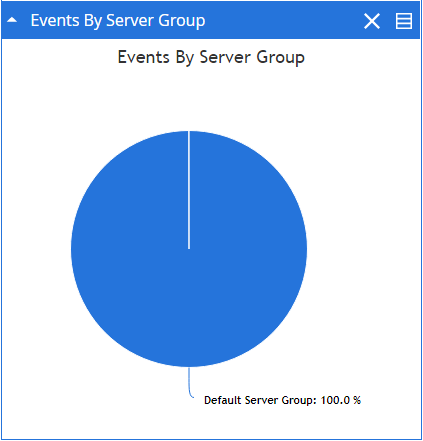
Events by Server Group
The Events by Server Group widget provides information about the automation processes from various server groups. The information is displayed as a pie chart. Each section of the chart displays the number of times automation processes are processes that belongs to the server group that the section represents.
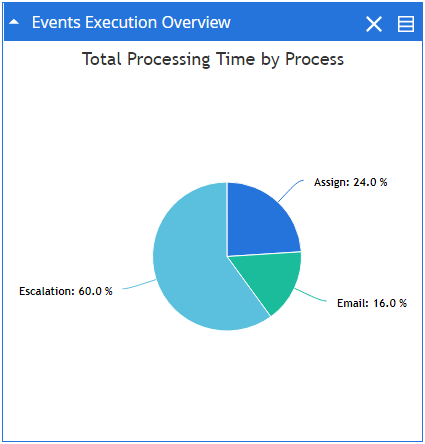
Events Execution Overview
The Events Execution Overview widget provides information about the total processing time for each automation process. The information is displayed as a pie chart. Each section of the chart provides information about the processing time for the automation that the section represents.
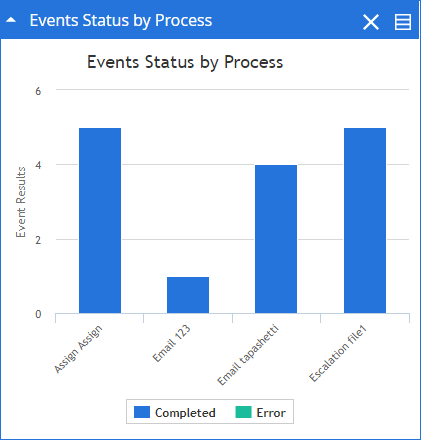
Event Status by Process
The Event Status by Process widget provides information about the automation processes that are processed. The information is displayed as a column chart. Each column displays the number of times the process has been processed successfully and the number of times it encountered an error.
Overall Events Status
The Overall Events Status widget provides information about all of the automation processes that are run. The information is displayed as a pie chart. The chart provides the number of times the automation processes run successfully and the number of times they encountered an error.
Process Status
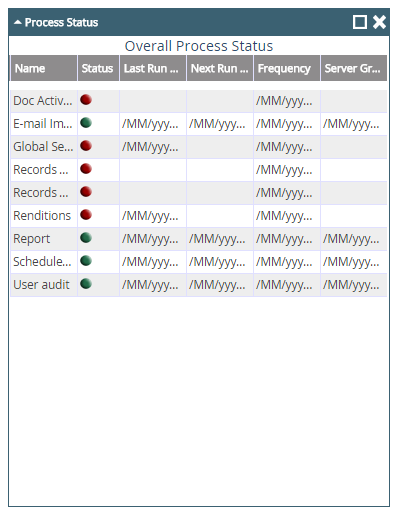
The Process Status widget provides information about all available automation processes including the status of a process, its last run date, next run date, frequency, and the server group a process belongs to.
Today's Events
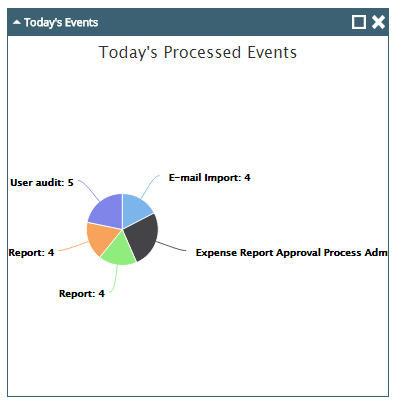
The Today's Events widget provides information about the automation processes that were run today. The information is displayed as a pie chart. Each section of the chart provides information about the number of times the automation process that the section represents was run today.
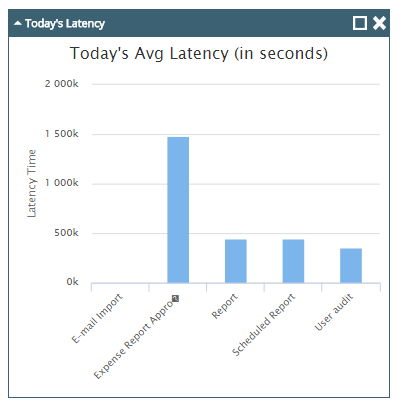
Today's Latency
The Today's Latency widget provides information about the time interval between consecutive execution of an automation process. The information is displayed as a column chart. Each column of the chart provides information about the latency time for the automation process that the column represents.
