Note: This feature is only available for Enterprise and Workflow licenses. See FileBound licensing for more information.
The following file and document activity widgets are available in FileBound:
Form Count By Project
Form Submissions by Month and Form
Form Submissions By Project
Submission Form Types By Project
Submissions by Form
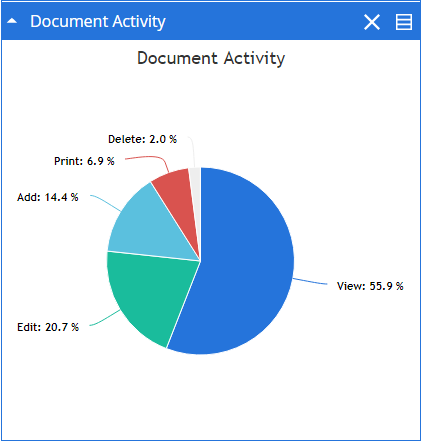
Document Activity
The Document Activity widget provides information about the activities that are performed on the documents in FileBound. The information is displayed as a pie chart. The sections of the chart display the name of the activity performed on the documents. You can move the mouse pointer over a section in the chart to display the number of documents on which the activity that the section represents is performed.
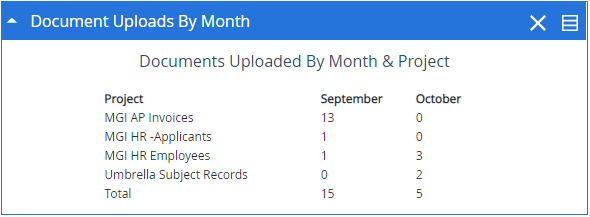
Document Uploads By Month
The Document Uploads By Month widget provides information about the number of documents uploaded for each project in the current month and the previous month.
File Activity
The File Activity widget provides information about the activities that are performed on the files in FileBound. The information is displayed as a pie chart. Each section represents an activity performed on the files. You can move the mouse pointer over a section in the chart to display the number of files on which the activity that the section represents was performed.

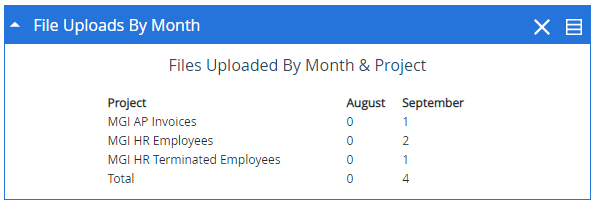
File Uploads By Month
The File Uploads by Month widget provides information about the number of files uploaded for each project in the current month and the previous month.
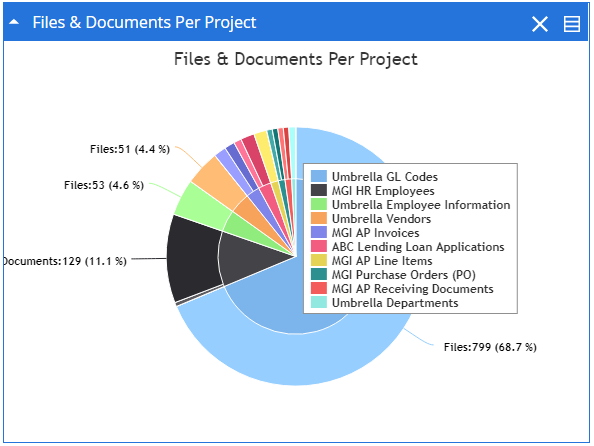
Files & Documents Per Project
The Files & Documents Per Project widget provides information about the files and documents in each project. The information is displayed as a pie chart. The inner section of the chart represents the projects and the outer section represents files and documents. You can move the mouse pointer over a section in the chart to display the number of files and documents in a project that the section represents.
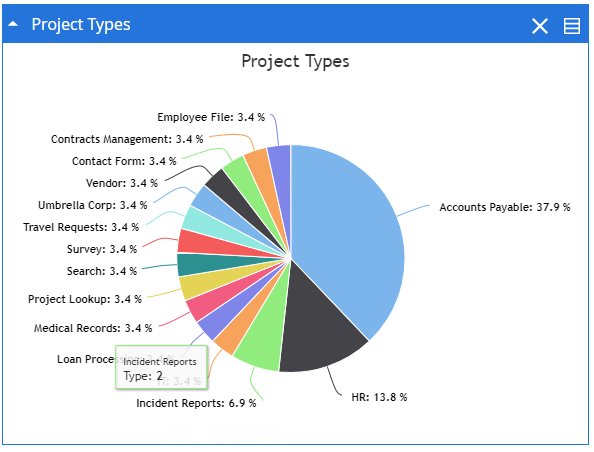
Project Types
The Project Types widget provides information about the type of projects available in FileBound. The information is displayed as a pie chart. Each section of the chart represents a type. You can move the mouse pointer over a section in the chart to display the number of projects for the project type that the section represents.
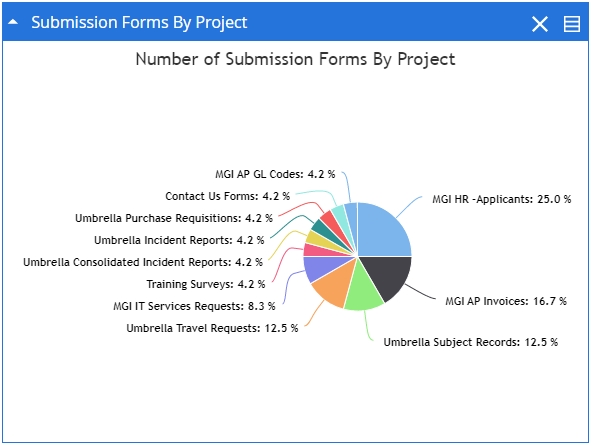
Submission Forms By Project
The Submission Forms By Project widget provides information about the number of submission forms in each project. The information is displayed as a pie chart. Each section of the chart represents a project. You can move the mouse pointer over a section in the chart to display the number of submission forms in the project that the section represents.
Submission Form Types By Project
