System reports widgets
Note: This feature is only available for Enterprise and Workflow licenses. See FileBound licensing for more information.
The following system reports widgets are available in FileBound:
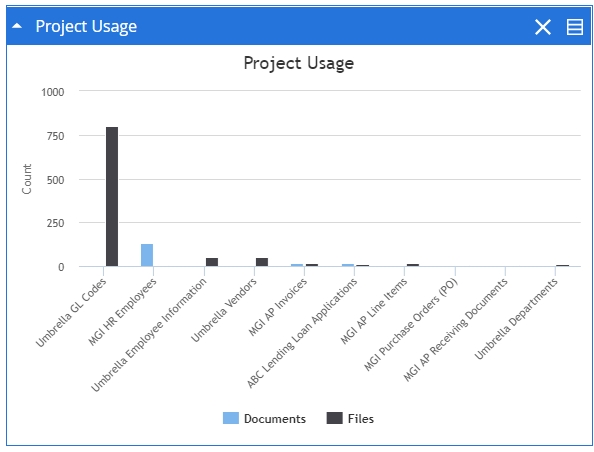
Project Usage
The Project Usage widget provides information about the number of files and documents available in each project. The information is displayed as a column chart. Each column of the chart displays the number of files and documents in the project that the bar represents. You can move the mouse pointer over a column in the chart to display the number of files and documents within the project that the column represents.

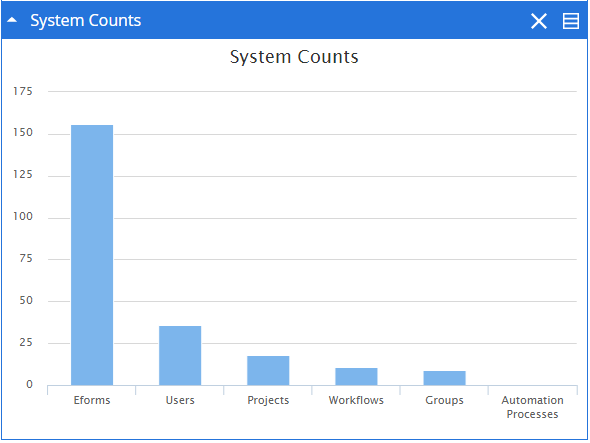
System Counts
The System Counts widget provides information about the number of users, groups, projects, workflows, automation processes, and forms in FileBound. The information is displayed as a column chart. Each column of the chart displays the number of the entity it represents. You can move the mouse pointer over a column in the chart to display the count for the entity that the column represents.
