Note: This feature is only available for Enterprise and Workflow licenses. See FileBound licensing for more information.
The following workflow reporting widgets are available in FileBound:
Performance Comparison
Predictive Analytics
Workflow Benchmark
Workflow History Average Time Per Step
Workflow History Documents Per Step
Workflow History Users Per Step
Workflow Step Productivity Analysis
Workflow User Productivity Analysis
Active Documents Per Step
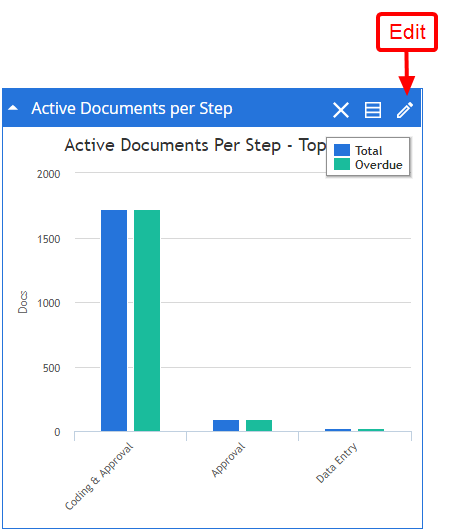
The Active Documents Per Step widget provides information about the documents that are currently in a step of a workflow process. The information is displayed as a column chart. Each column displays the total number of documents and the documents that are past their due date within the step. You can click a column in the chart to view the information about the documents that the bar represents.
You can modify the title of the widget, color of the title bar, project, and workflow process by clicking Edit on the title bar.
Active Users Per Step
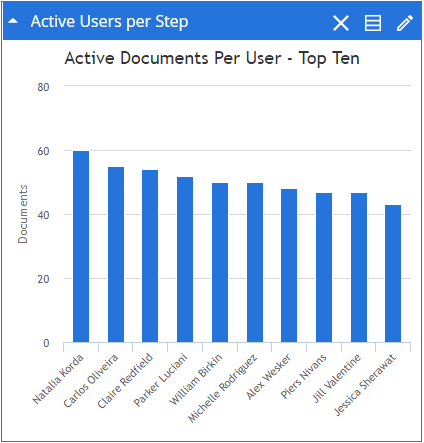
The Active Users Per Step widget provides information about the top ten users that are assigned to the most documents in a workflow. The information is displayed as a column chart. Each column of the chart displays the number of documents assigned to a user. You can click a column in the chart to display information about the documents assigned to the user that the bar represents.
You can modify the title of the widget, the color of the title bar, the project, and the workflow process by clicking Edit on the title bar.
Items In Workflow
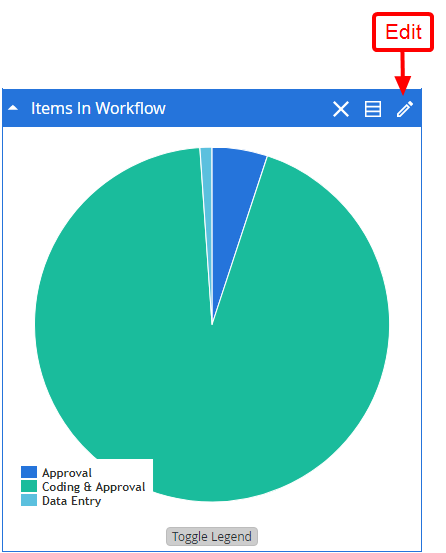
The Items in Workflow widget provides information about the documents that are at various steps in a workflow process. You can click a section of the chart to display the information regarding the documents that the section represents. From the documents list, you can open a files in a Viewer.
You can modify the title of the widget, the color of the title bar, the project, the workflow process, and how the list of documents is displayed by clicking Edit on the title bar.
Top Five Used Workflows
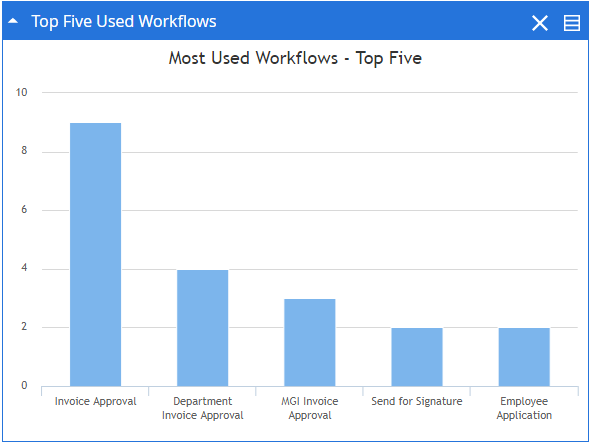
The Top Five Used Workflows widget provides information about the top five workflow processes that have the most documents. The information is displayed as a column chart. Each column on the chart displays the number of documents currently available in the workflow process that the column represents.
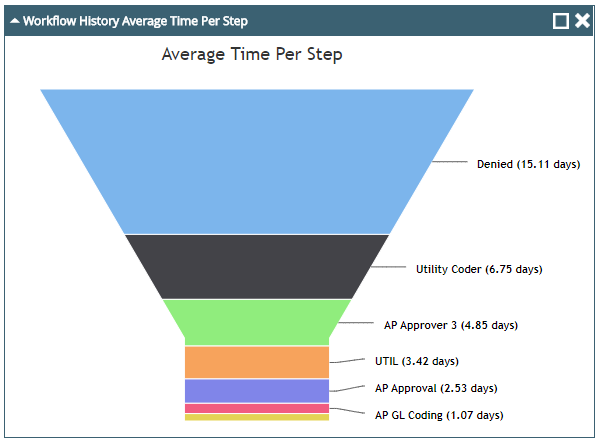
Workflow History Average Time Per Step
The Workflow History Average Time Per Step widget provides information about the average time to process documents in a workflow.
You can modify the title of the widget, the color of the title bar, the project, and the workflow process by clicking Edit on the title bar.
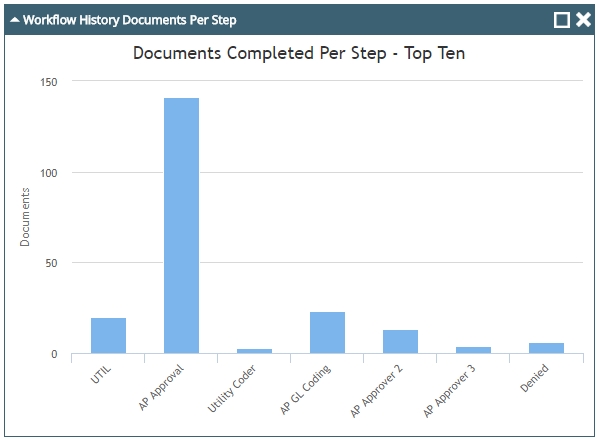
Workflow History Documents Per Step
The Workflow History Documents Per Step widget provides information about the number of documents processed on each step of a workflow process. The information is displayed as a column chart. Each column of the chart displays the number of documents processed on a step that the column represents.
You can modify the title of the widget, the color of the title bar, the project, and the workflow process by clicking Edit on the title bar.
Workflow History Users Per Step
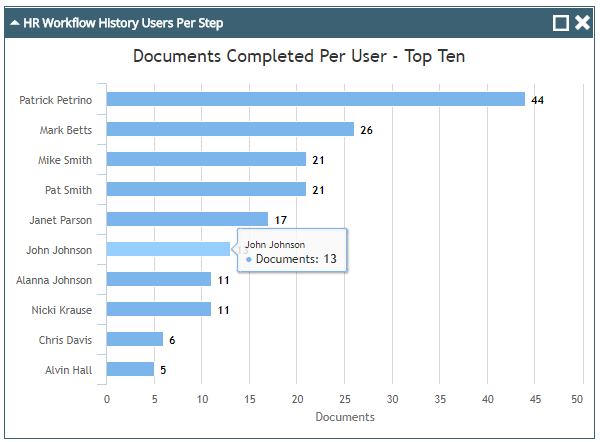
The Workflow History Users Per Step widget provides information about the top ten users that have processed the most documents in a workflow. The information is displayed as a bar chart. Each bar of the chart displays the number of documents processed by a user. You can click a bar in the chart to display information about the documents processed by the user that the bar represents.
You can modify the title of the widget, the color of the title bar, the project, and the workflow process by clicking Edit on the title bar.
