The following dashboard widgets are available in FileBound:
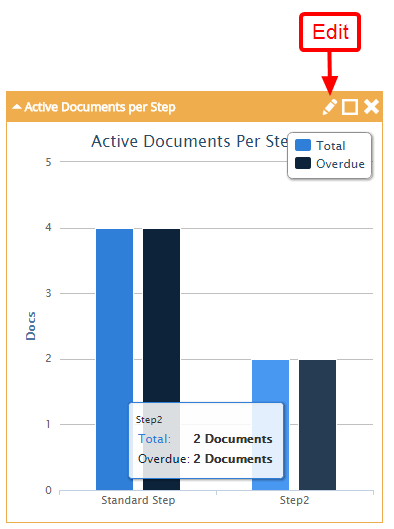
The Active Documents Per Step widget provides information about the documents that are currently in a step of a workflow process. The information is displayed as a bar chart. Each bar displays the total number of documents and the documents that are past their due date within the step. You can click a bar in the chart to view the information about the documents that the bar represents.
You can modify the title of the widget, color of the title bar, project, and workflow process by clicking Edit on the title bar.
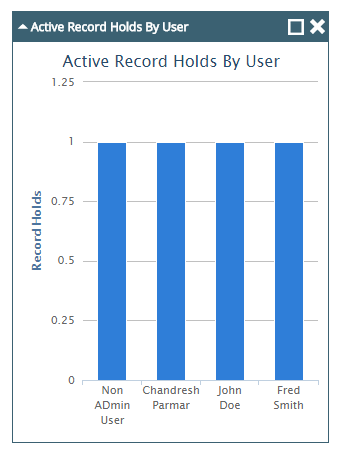
The Active Record Holds By User widget provides information about the records put on hold by users.
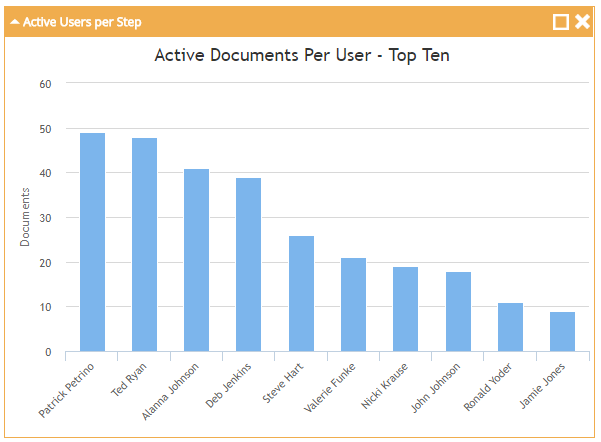
The Active Users Per Step widget provides information about the top ten users that are assigned to the most documents in a workflow. The information is displayed as a bar chart. Each bar of the chart displays the number of documents assigned to a user. You can click a bar in the chart to display information about the documents assigned to the user that the bar represents.
You can modify the title of the widget, the color of the title bar, the project, and the workflow process by clicking Edit on the title bar.
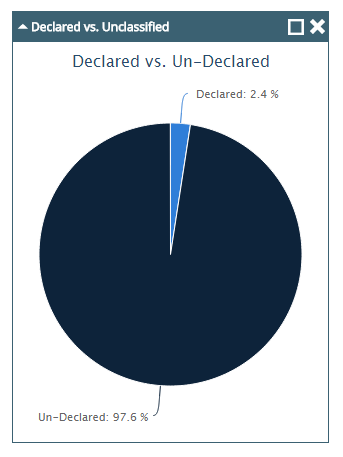
The Declared Vs. Unclassified widget provides information about the documents that are declared and undeclared as records. The information is displayed as a pie chart. Each section of the chart represents the percentage of the documents that are declared and undeclared as records.
The Document Activity widget provides information about the activities that are performed on the documents in FileBound. The information is displayed as a pie chart. The sections of the chart display the name of the activity performed on the documents. You can move the mouse pointer over a section in the chart to display the number of documents on which the activity that the section represents is performed.
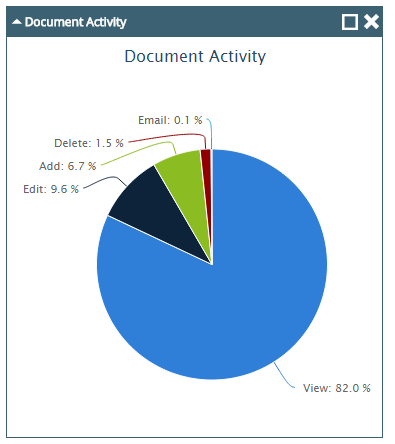
The Document Uploads By Month widget provides information about the number of documents uploaded for each project in the current month and the previous month.

The Event Status by Process widget provides information about the automation processes that are processed. The information is displayed as a bar chart. Each bar displays the number of times the process has been processed successfully and the number of times it encountered an error.
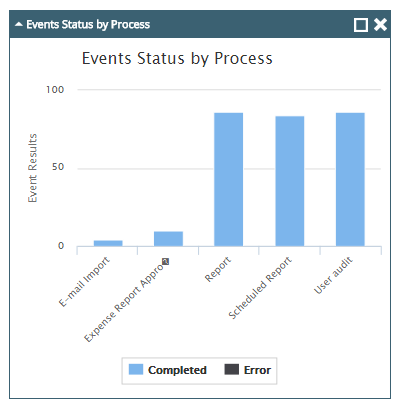
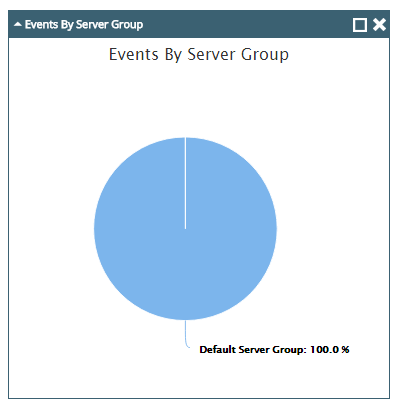
The Events by Server Group widget provides information about the automation processes from various server groups. The information is displayed as a pie chart. Each section of the chart displays the number of times automation processes are processes that belongs to the server group that the section represents.
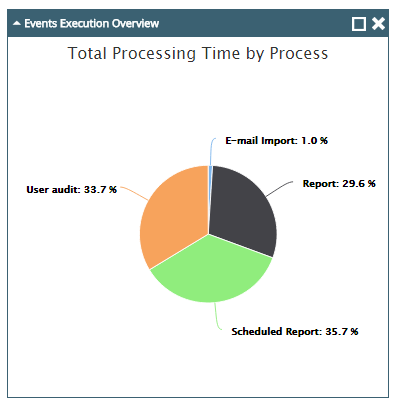
The Events Execution Overview widget provides information about the total processing time for each automation process. The information is displayed as a pie chart. Each section of the chart provides information about the processing time for the automation that the section represents.
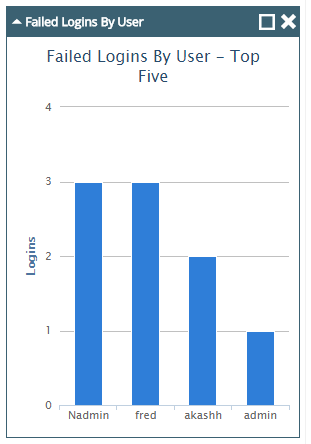
The Failed Logins By User widget provides information about the failed attempts by users to log in to FileBound. The information is displayed as a bar chart. Each bar of the chart displays the number of failed logon attempts by a user. You can click a bar in the chart to view the information about the number of failed log in attempts by the user that the bar represents.
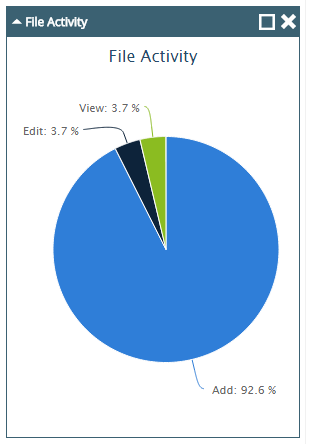
The File Activity widget provides information about the activities that are performed on the files in FileBound. The information is displayed as a pie chart. Each section represents an activity performed on the files. You can move the mouse pointer over a section in the chart to display the number of files on which the activity that the section represents was performed.
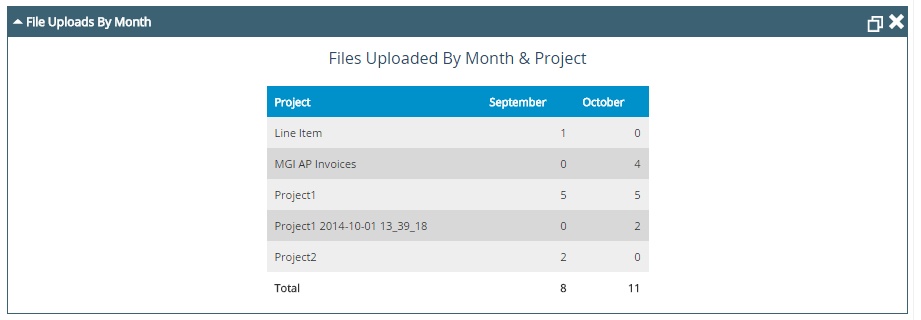
The File Uploads by Month widget provides information about the number of files uploaded for each project in the current month and the previous month.
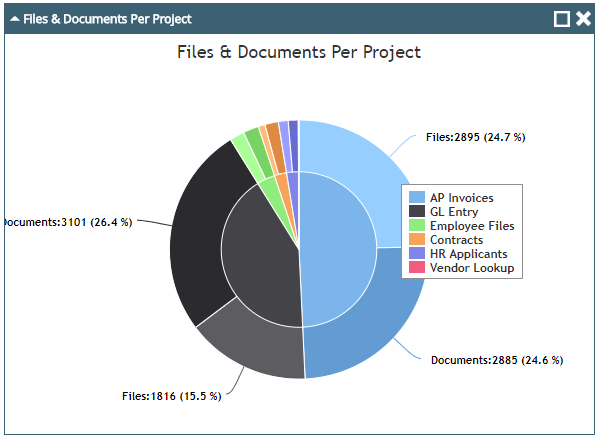
The Files & Documents Per Project widget provides information about the files and documents in each project. The information is displayed as a pie chart. The inner section of the chart represents the projects and the outer section represents files and documents. You can move the mouse pointer over a section in the chart to display the number of files and documents in a project that the section represents.
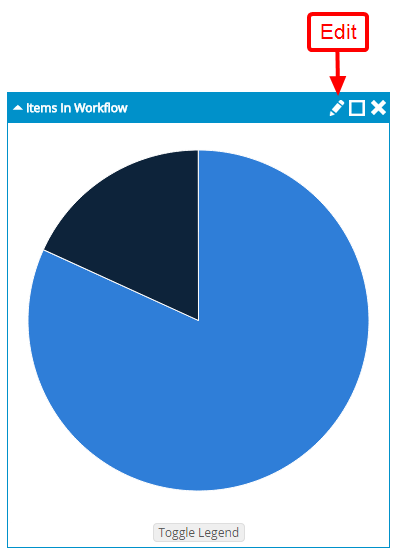
The Items in Workflow widget provides information about the documents that are at various steps in a workflow process. You can click a section of the chart to display the information regarding the documents that the section represents. From the documents list, you can open a files in a Viewer. The title of the widget, color of the title bar, project, workflow process, and format options for the list of documents can be modified.
You can modify the title of the widget, the color of the title bar, the project, the workflow process, and how the list of documents is displayed by clicking Edit on the title bar.
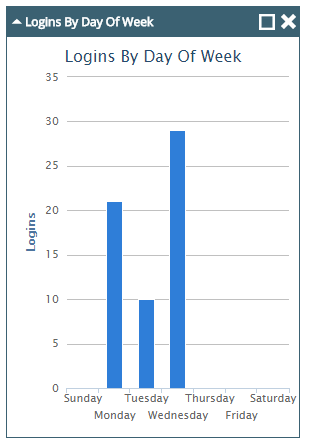
The Logins By Day Of Week widget provides information about the number of log ins on each day of the week. The information is displayed as a bar chart. Each bar of the chart displays the number of log ins for that day. You can click a bar in the chart to view the information about the users that logged in during the day that the bar represents.
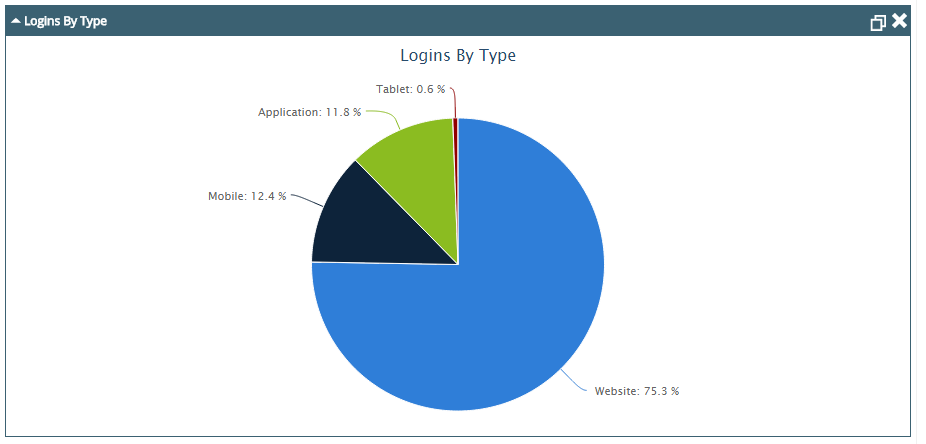
The Logins By Type widget provides information about the log ins from website, application, mobile, and tablet. The information is displayed as a pie chart. Each section of the chart represents a login type. You can move the mouse pointer over a section in the chart to display the number of log ins for the type that the section represents.
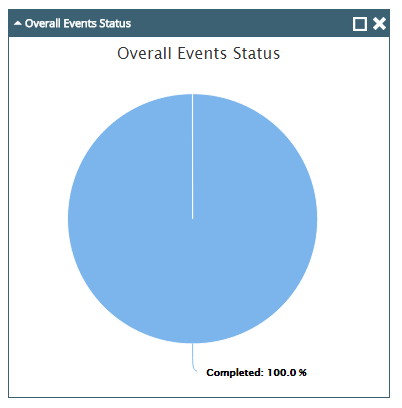
The Overall Events Status widget provides information about all of the automation processes that are run. The information is displayed as a pie chart. The chart provides the number of times the automation processes run successfully and the number of times they encountered an error.
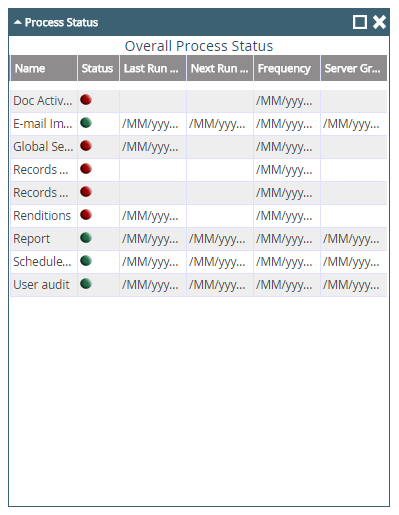
The Process Status widget provides information about all available automation processes including the status of a process, its last run date, next run date, frequency, and the server group a process belongs to.
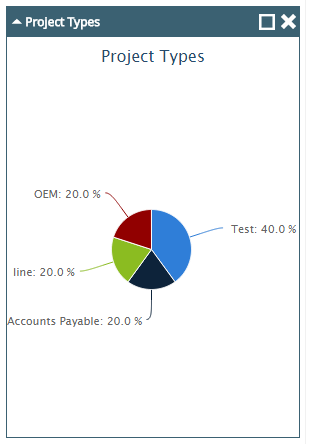
The Project Types widget provides information about the type of projects available in FileBound. The information is displayed as a pie chart. Each section of the chart represents a type. You can move the mouse pointer over a section in the chart to display the number of projects for the project type that the section represents.
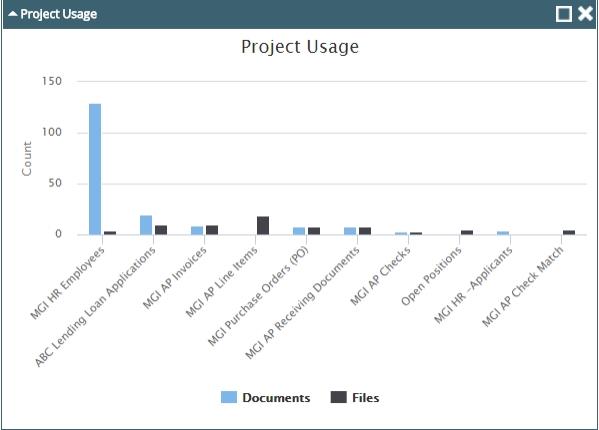
The Project Usage widget provides information about the number of files and documents available in each project. The information is displayed as a bar chart. Each bar of the chart displays the number of files and documents in the project that the bar represents. You can move the mouse pointer over a bar in the chart to display the number of files and documents within the project that the bar represents.
The Record Series Destruction Size widget provides information about the amount of memory that will be freed by deleting the records in the next six months.
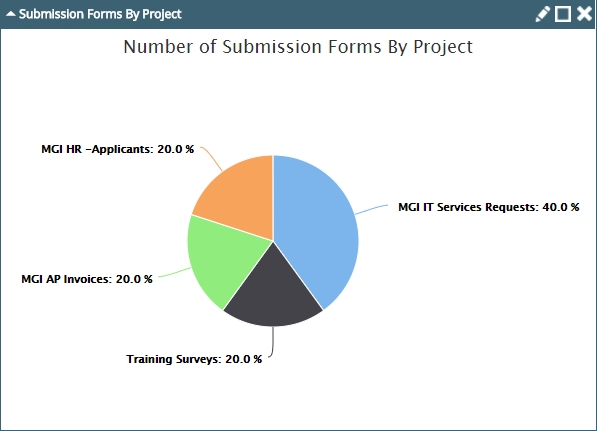
The Submission Forms by Project widget provides information about the number of submission forms in each project. The information is displayed as a pie chart. Each section of the chart represents a project. You can move the mouse pointer over a section in the chart to display the number of submission forms in the project that the section represents.
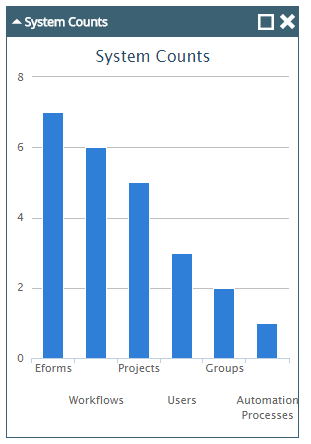
The System Counts widget provides information about the number of users, groups, projects, workflows, automation processes, and forms in FileBound. The information is displayed as a bar chart. Each bar of the chart displays the number of entity it represents. You can move the mouse pointer over a bar in the chart to display the count for the entity that the bar represents.
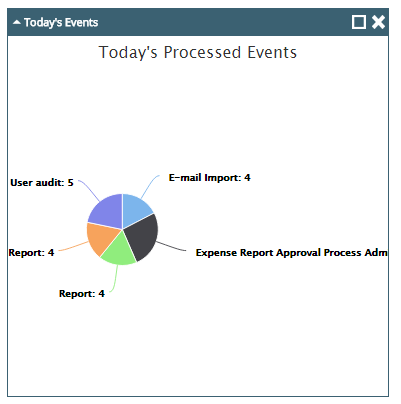
The Today's Events widget provides information about the automation processes that were run today. The information is displayed as a pie chart. Each section of the chart provides information about the number of times the automation process that the section represents was run today.
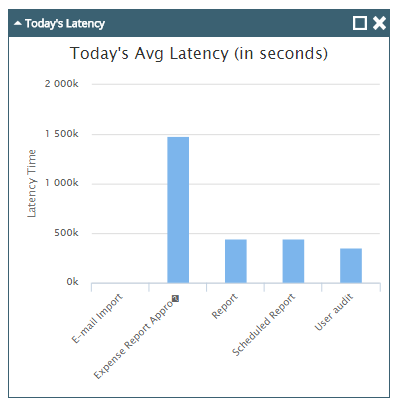
The Today's Latency widget provides information about the time interval between consecutive execution of an automation process. The information is displayed as a bar chart. The bar of the chart provides information about the latency time for the automation process that the bar represents.
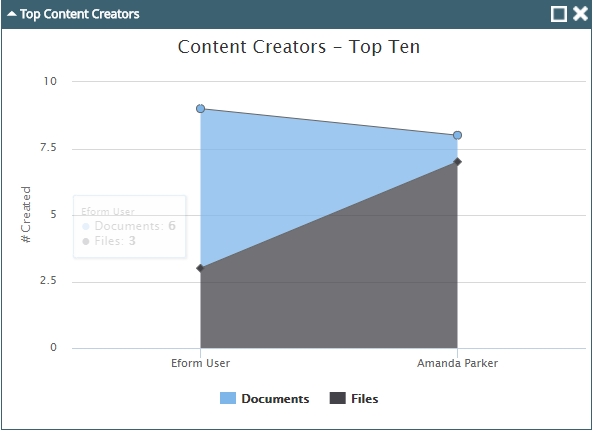
The Top Content Creators widget provides information about the top ten users that have created the most files and documents in FileBound. The information is displayed as a line chart. Each point on the chart displays the number of files and documents crated by the user that the point represents.
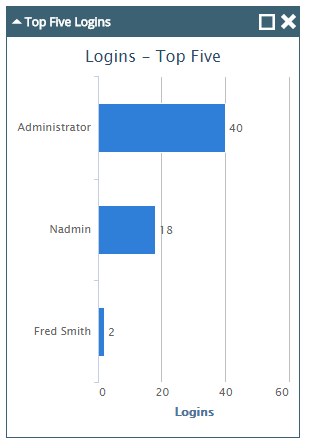
The Top Five Logins widget provides information about the top five users that have logged in to FileBound the most. The information is displayed as a bar chart. Each bar of the chart displays the number of times a user has logged in to FileBound. You can click a bar to view log in information of the user that the bar represents.
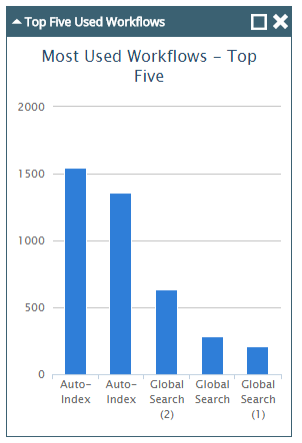
The Top Five Used Workflows widget provides information about the top five workflow processes that have the most documents. The information is displayed as a bar chart. Each bar on the chart displays the number of documents currently available in the workflow process that the bar represents.
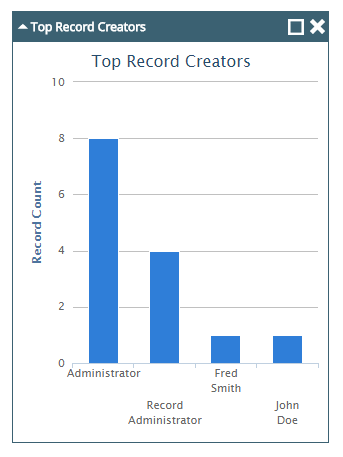
The Top Record Creators widget provides information about the top ten users that have declared the most records. The information is displayed as a bar chart. Each bar displays the number of records declared by the user that the bar represents.
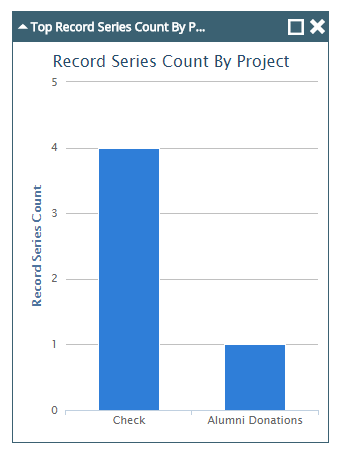
The Top Record Series Count By Project widget provides information about the top ten projects that have the largest number of record series. The information is displayed as a bar chart. Each bar of the chart displays the number of record series available in the project that the bar represents. You can click on a bar in the chart to view the information about the record series available in the project.
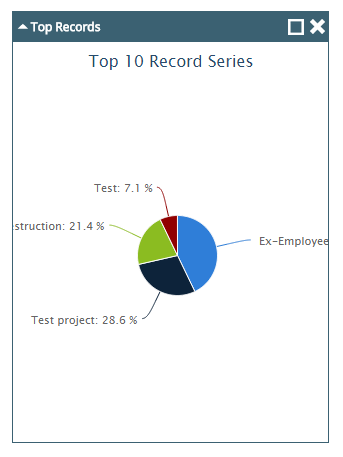
The Top Records widget provides information about the top ten record series that contain the greatest number of records. The information is displayed as a pie chart. Each section of the chart represents the number of records that are available in the record series.
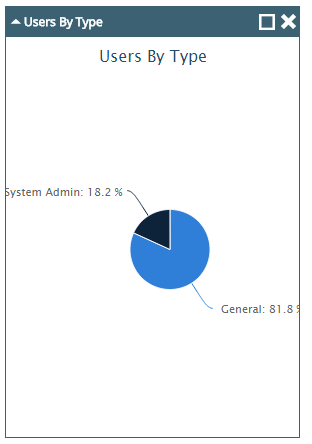
The Users By Type widget provides information about the number of users in each group in FileBound. The information is displayed as a pie chart. Each section of the chart displays the number of user in the group that section represents. You can click a section in the chart to display information about the users in the group that the section represents.
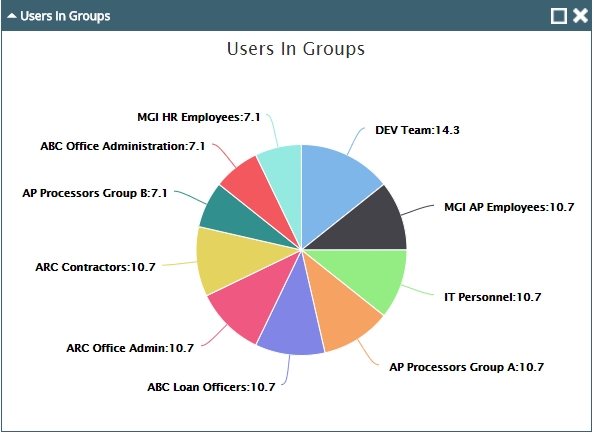
The Users In Groups widget provides information about the number of users in various groups within FileBound. The information is displayed as a pie chart. Each section of the chart displays the number of users in the group that the section represents. You can click a section in the chart to display information about the user in the group that the section represents.
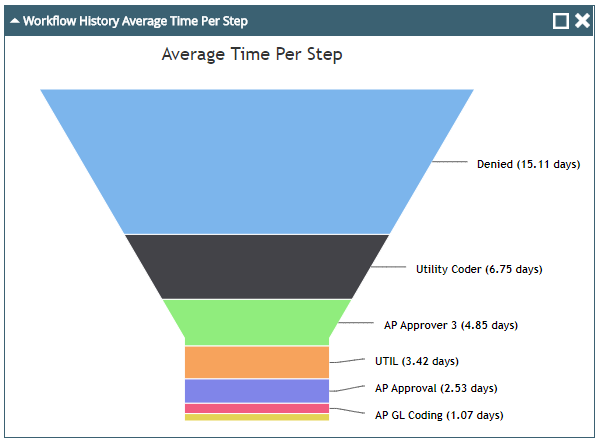
The Workflow History Avg Time Per Step widget provides information about the average time to process documents in a workflow. The title of the widget, color of the title bar, project, and workflow process can be modified.
You can modify the title of the widget, the color of the title bar, the project, and the workflow process by clicking Edit on the title bar.
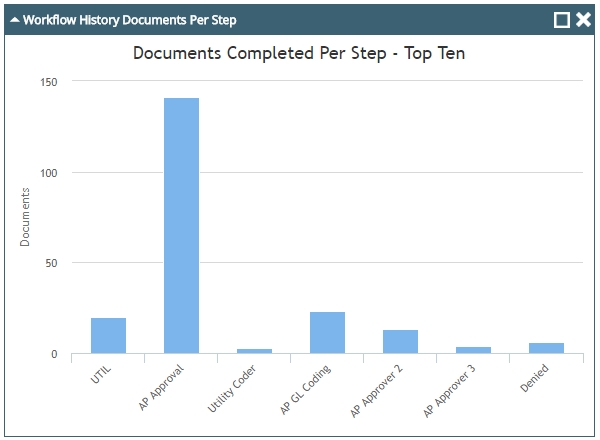
The Workflow History Documents Per Step widget provides information about the number of documents processed on each step of a workflow process. The information is displayed as a bar chart. Each bar of the chart displays the number of documents processed on a step that the bar represents. The title of the widget, color of the title bar, project, and workflow process can be modified.
You can modify the title of the widget, the color of the title bar, the project, and the workflow process by clicking Edit on the title bar.
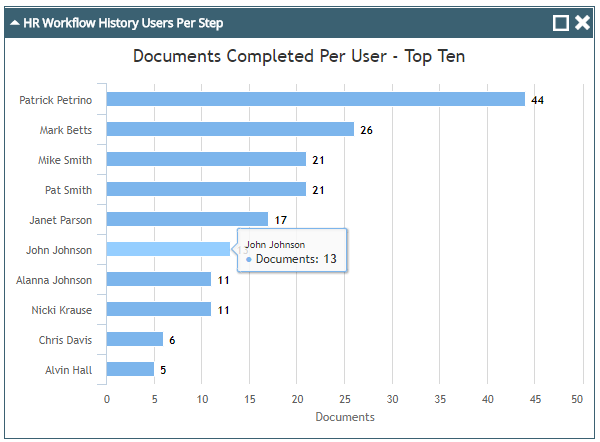
The Workflow History Users Per Step widget provides information about the top ten users that have processed the most documents in a workflow. The information is displayed as a bar chart. Each bar of the chart displays the number of documents processed by a user. You can click a bar in the chart to display information about the documents processed by the user that the bar represents. The title of the widget, the color of the title bar, the project, and the workflow process can be modified.
You can modify the title of the widget, the color of the title bar, the project, and the workflow process by clicking Edit on the title bar.
Menu