Not knowing how content is performing - internally or externally - can lead to issues for marketer's making decisions on a piece of content's value as well as the inability to plan, based on not knowing how content actually performs.
The value of the Kapost Gallery Insights covers three core areas:
- Having content analytics empowers users to make better and more informed decisions on how and when to use content
- Gives users information on how content performed in the “real world” which adds context to the customer experience
- Seeing how content has performed allows evaluation of its continued use in the future
Note: You must be an authenticated user of Kapost to be able to see the Gallery Insights. You must also have access to insights as enabled by a Kapost Admin in Studio Settings. Learn how to adjust this setting here.
Viewing Insights
Gallery insights can be viewed for each piece of content as well as the whole collection.
To view insights for each content, follow the steps below:
-
Go to Gallery and select the desired collection. This displays all content within the collection.
-
Select the desired content and click on the Insights tab.
-
Alternatively, click the insights
 icon on the content thumbnail.
The insights displayed for a content are the statistics when the content is shared/downloaded/viewed/clicked from anywhere (within or outside a collection) in the Gallery.
To view insights for a collection, follow the steps below:
-
Go to Gallery and select the desired collection.
-
Click the Insights button on the top-right corner of the screen.

The insights displayed for a collection are the combined statistics for each content when shared/downloaded/viewed/clicked from within the collection.

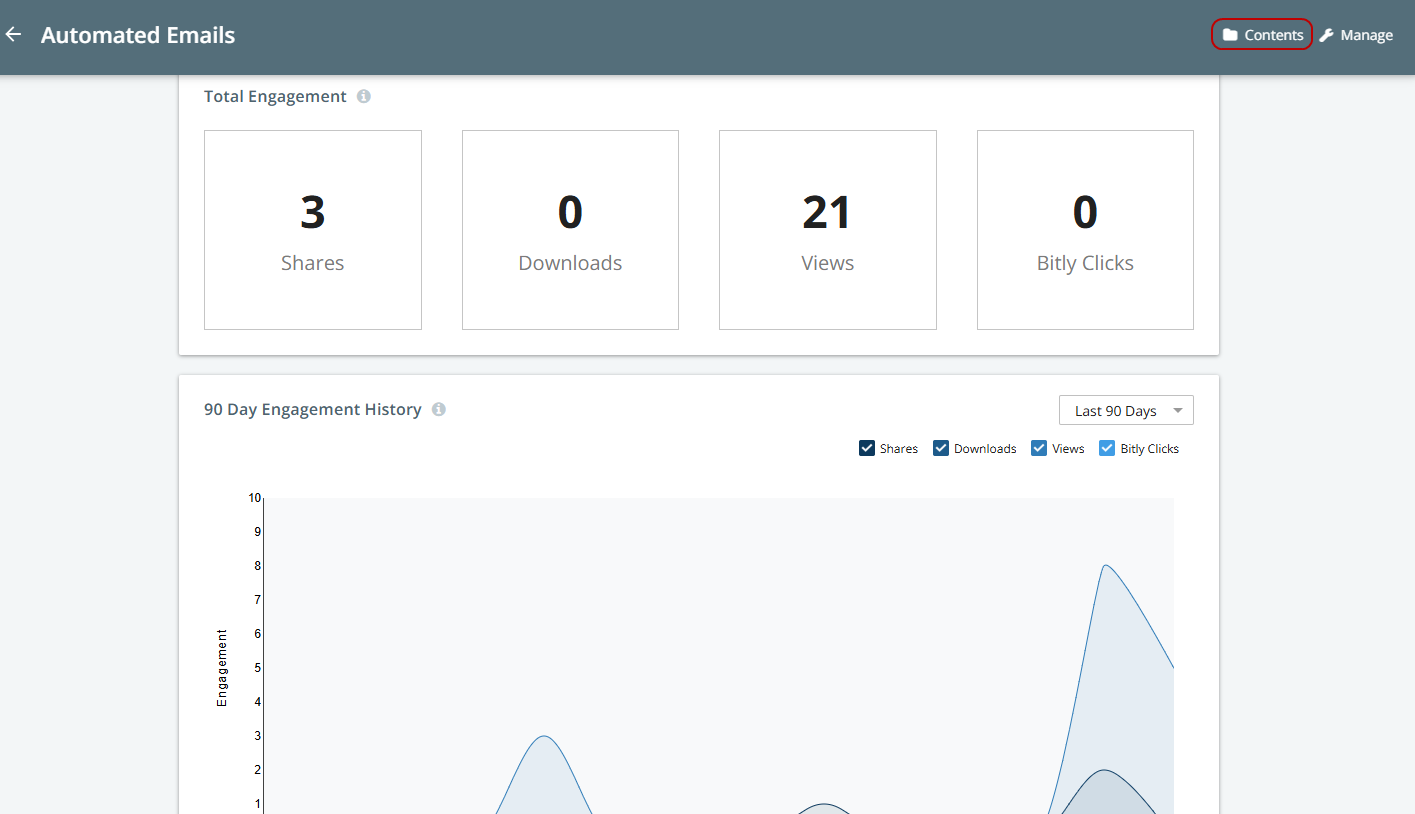
After reviewing the insights, use the Contents button located at the top-right corner to return to the previous page.
Total Engagement
These are the internal and external statistics of key engagement categories that we have been tracking on this piece of content.

- Shares: The number of times the asset has been shared from the Kapost Gallery as well as other channels. Kapost counts the number of times that content was shared on different social channels directly and the amount the content was re-shared (or retweeted) while on that social media channel.
- Downloads: The number of times the asset has been downloaded.
- Views: The number of times the asset has been viewed.
- Clicks: The number of times the asset has been clicked on.

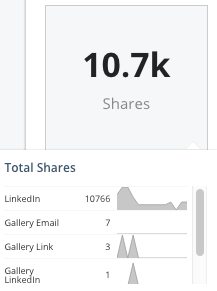
Click the tiles for each to see where the metrics come from. Each graph shows the last 90 days.
90 Day Engagement History
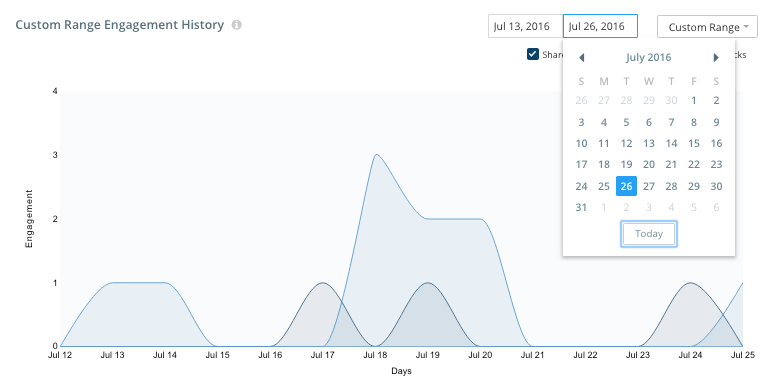
The trending graph was designed to give you an interactive way to see the trending metrics of the asset's life. Use the checkboxes and date ranges to see different criteria.
Note: See custom date ranges by selecting Custom Range from the drop-down menu then selecting the correct dates.
