Analytics Definitions
Content Asset Stats
Once a piece of content is published, the Content page will display various statistics about that content in the Stats section at the bottom of the individual asset's page. Below are definitions for all of the available statistics on the Content page.
Note: Not all statistics are available for every Content Type. i.e. Download statistics are not available on a blog post.
|
|
The total number of times the given piece of content was viewed. Please note, this does not track documents. To track documents published to Kapost, you need to look at the Download metric. |
|
|
The total number of times the given piece of content's published URL (unshortened) was shared on Facebook. It counts as a share if:
|
|
|
The number of times Facebook users liked any shared content, or liked any comments or re-shares of that shared content. |
|
|
The number of times the given tweet was re-tweeted if tweet was published through Kapost. |
|
|
The total number of clicks the outbound links in the given piece of content received. Note: Kapost only tracks clicks on links that are shortened using Kapost's link shortener within the HTML text box body of content. |
|
|
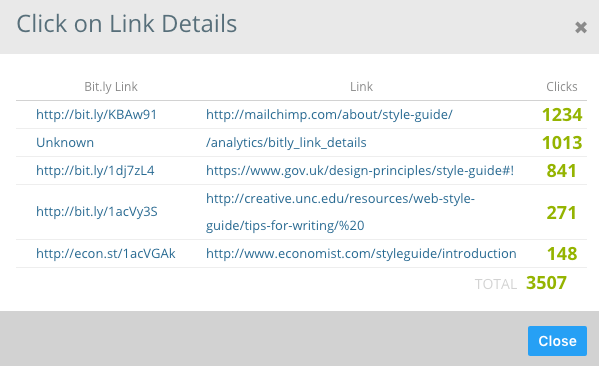
Shortened links that have contributed to your "Clicks on Link" stat. |
|
|
The total number of times the given YouTube video was viewed. |
|
|
The total number of comments viewers made on the given YouTube video. |
|
|
The total number of inbound links linking to the given piece of content. |
|
|
The referrer links that have brought people to your content. |
|
|
The total number of times the Kapost tracking URL for a Document was clicked. |
|
|
New Leads represents the number of times a new Marketo or Eloqua lead viewed the given piece of content.
|

Traffic generated from people clicking content through the bit.ly generated in the Gallery. The gallery bit.ly can be sent out through Facebook, X (formerly Twitter), LinkedIn, Email or by copying the bit.ly directly.
We also offer Analytics on Eloqua Email stats. For a breakdown of these analytics, click here.
Other Stat Notes:
- Lag Times: Kapost captures Page Views, Uniques, and Links near realtime. All other activity (social engagement, downloads, etc.), with the exception of YouTube activity, Kapost captures it 24 hours after it occurs around 2:00 - 4:00am Mountain Time. Kapost captures YouTube activity two days after it occurs.
- For information on analytics on archived content, please read this article.
Analytics Custom Reports
See related article Custom Reports for more information on the Custom Reports page.
See Insights Overview for an overview of the Insights app.

