Events
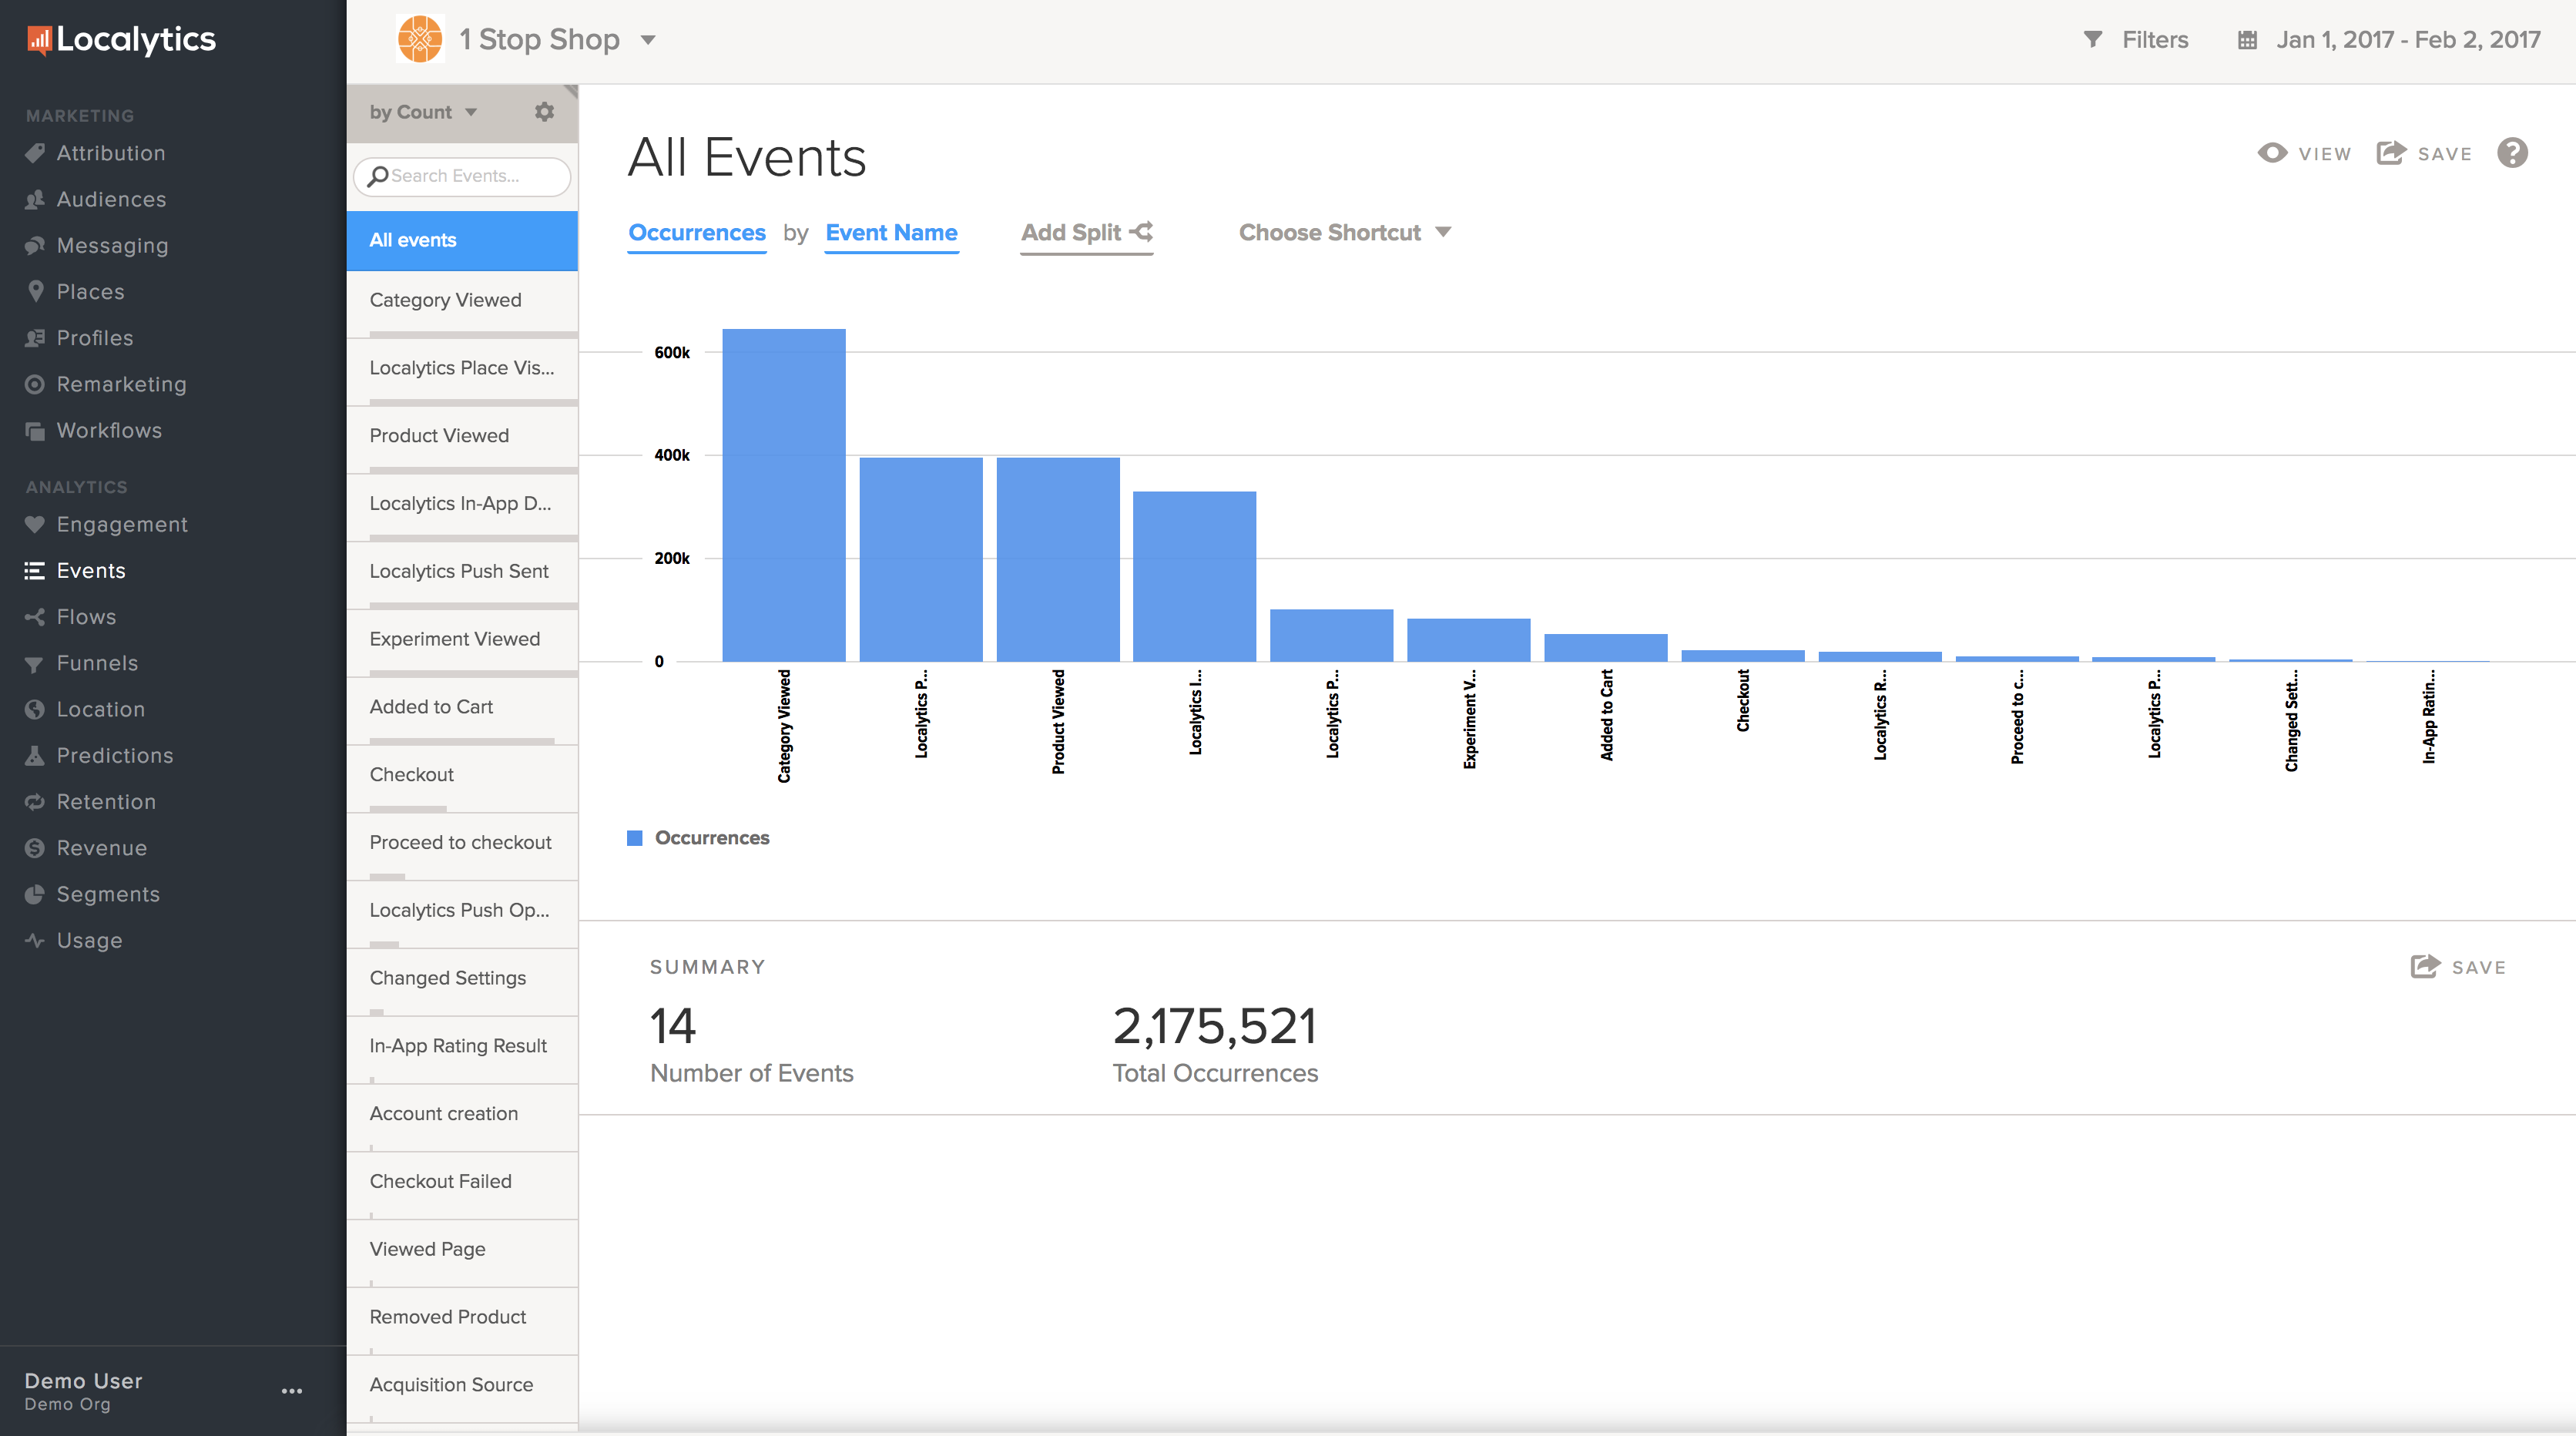
This report provides a summary of event behavior observed over a specified time period. For more information on events, see Events and event attributes.
Using the Events dashboard
To access the Events dashboard:
-
Go to Analytics in the left pane and select Events.

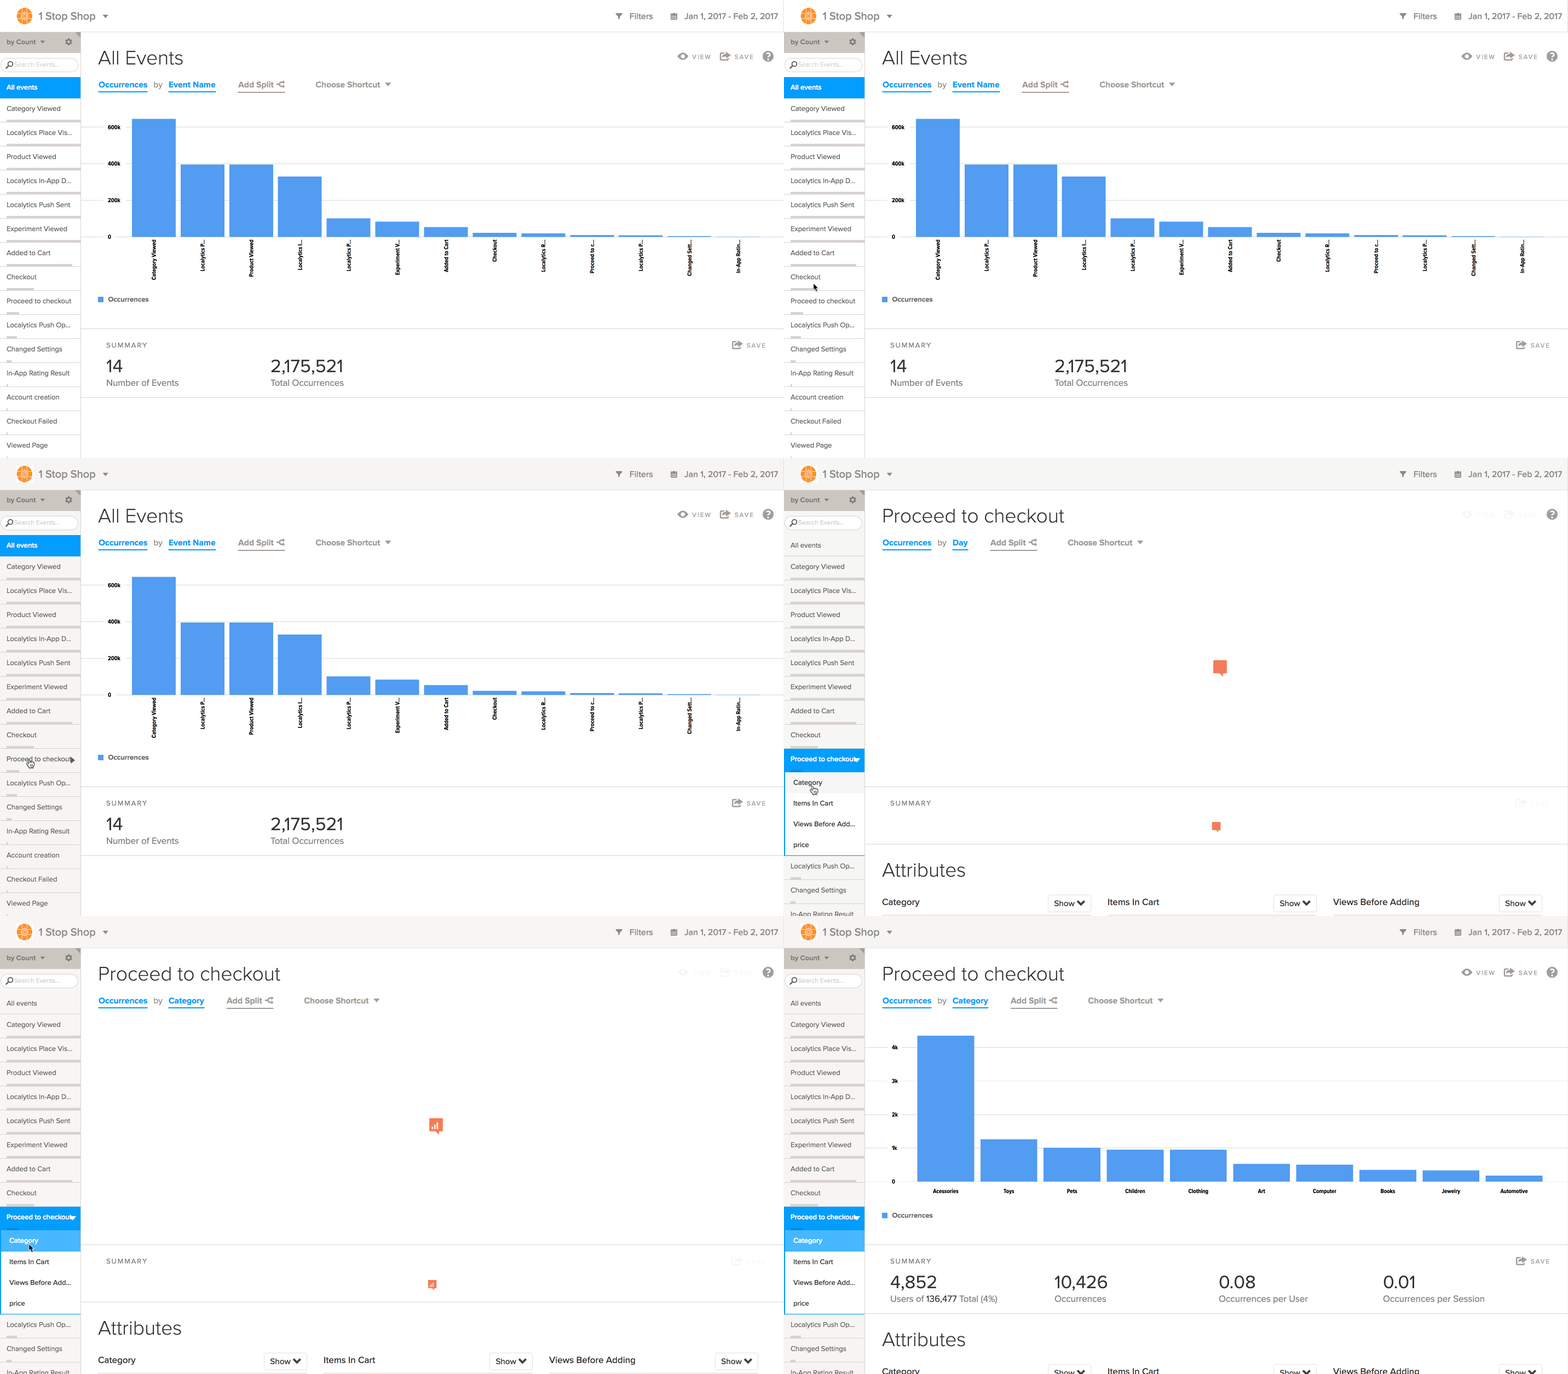
The Events report shows data for all of your events. The sidebar lists the events included in the report.
- To locate an event:
- Enter the event name in the search bar.
- At the top of the side bar, change the sort order: select by Count or by Name from the drop-down list.
-
To view data for a specific event, select the event's name in the sidebar.

-
To work with events in groups, select the gear icon at the top of the sidebar, and then select Manage Event Groups. For more information, see Event Groups.

Like most analytics reports, you can filter by dimension and/or profile, set a date range, change the view, save your report, apply data splits, and choose a shortcut. To learn more about these features, see Anatomy of an Analytics report
Metrics
The Events report provides the following metrics:
| Metric | Description |
|---|---|
| Users | Number of users who triggered the event |
| Occurrences | Number of times the event occurred |
| Sessions | Number of sessions during which the event occurred |
| Occurrences per User |
Number of times the event occurred divided by the total number of users in the app (regardless of whether they triggered the event of not) |
| Occurrences per Session | Number of times the event occurred divided by the total number of sessions |
Event groups
Event groups are used to combine a number of events together to see analytics aggregated from all of the selected events.
Event groups are similar to single events in terms of filtering and splitting data. Creating an event group may be beneficial if you have a number of events that you could combine into a single category (for example, grouping the viewing of certain men's clothing categories).
To create an event group from the Events report:
-
Select the gear icon at the top of the sidebar.
- From the Edit Event Groups page, select + New Group.
- Enter a name for the group.
- Select the green
 button to add events to the group.
 - Select the Add event(s) to group field and select an event from the drop-down list. Continue selecting all of the events for the group.
-
When you are done, select Save Changes.
The Events dashboard opens, with groups added to the top of the sidebar. The number of events in each group is indicated to the left of the group's name.
Data discrepancies
Tip: If the data you're seeing is different than expected, the most common explanation is that the event has not been instrumented as intended. For more information on the causes of data variance, see Why do my event or user counts in Localytics not match my internal database or App Store Developer analytics?
If you are seeing a value of "[Unspecified]" for a given event attribute, this means that the event was triggered with no value assigned for that event attribute. For more information, see Why do I see “[Unspecified]” reported for a given Event Attribute?.
How to use the Events report
The Events dashboard can surface a lot of different metrics and action items for your app. Use the Events report to:
- Know which behaviors are most popular in your app.
- Apply splits and filters to look for meaningful trends or outliers using any event attribute, dimension, or custom dimension.
- Determine on average how many times an event is being performed during a session by setting the metric to Occurrences per Session.
- Measure and monitor key performance indicators (KPIs). Identify events that constitute KPIs and create an Event report that you can export to a PDF or CSV file, add to a custom dashboard, or send daily, weekly, or monthly email updates.
- Use rate metrics such as Occurrences per User to observe trends for how often an average active user performs an event. This allows you to measure changes in behavior that are not related to overall usage spikes or dips.