Flows
Tip: Flows is powered by Flash. Make sure you've got Flash enabled on your browser to get the most out of this feature.
Using the Flows dashboard
To work with the Flows dashboard:
-
Go to Analytics in the left pane and select Flows.
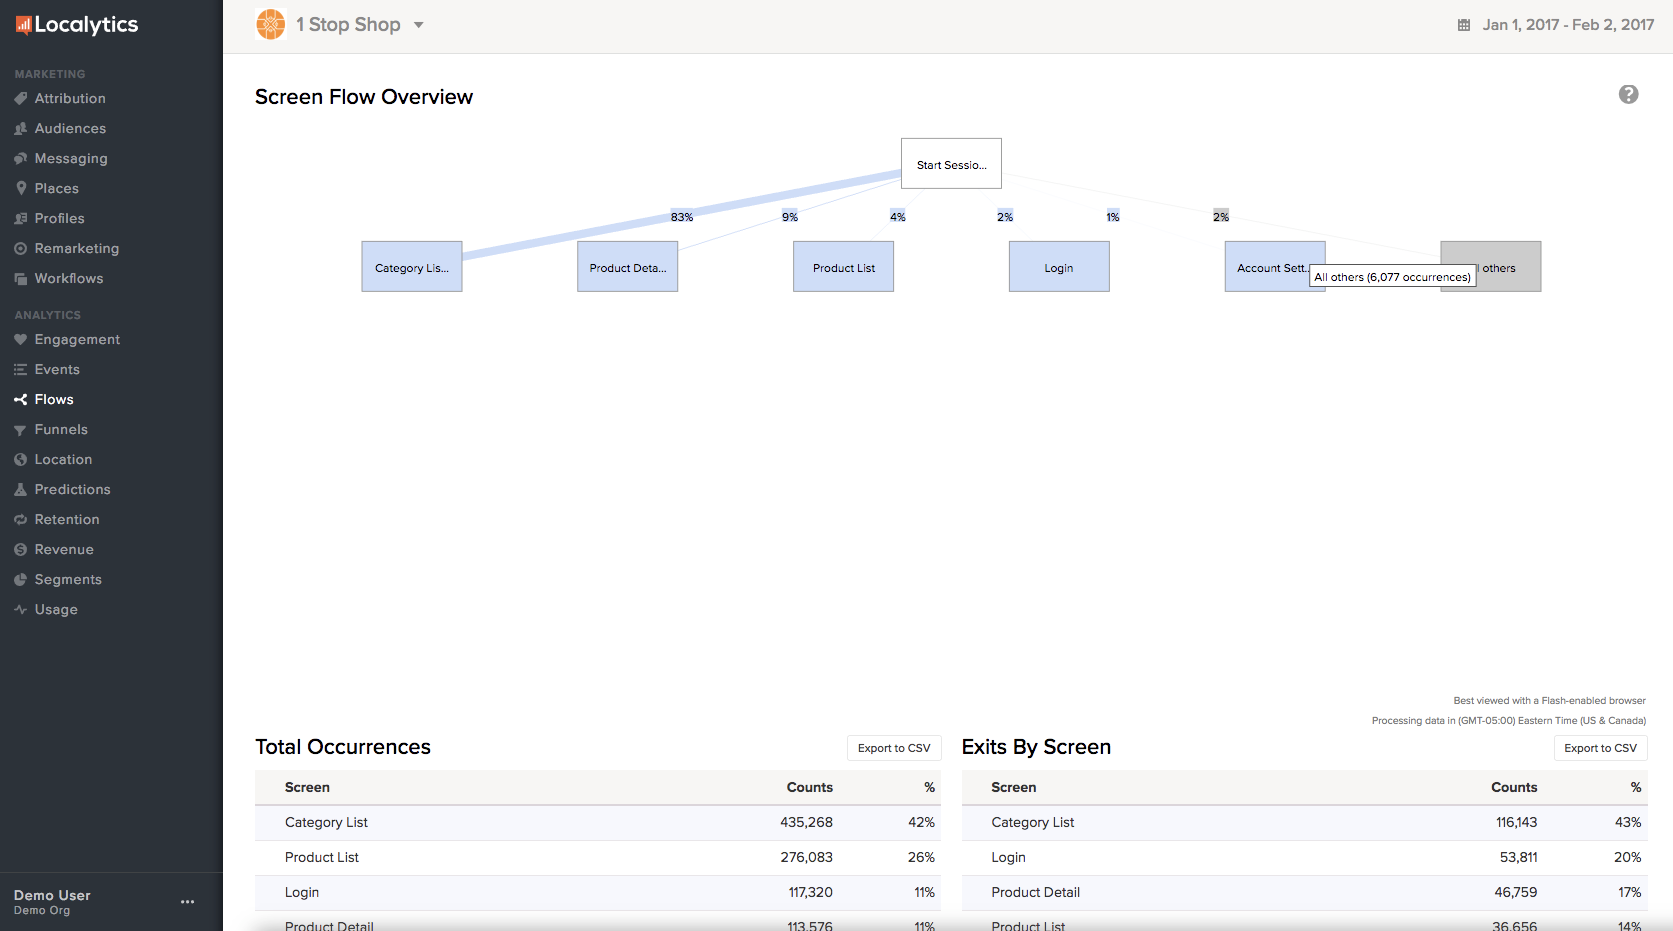
The Screen Flow Overview is an interactive tool that allows you to see the paths users took as they navigated through your app during the selected date range. For more information, see Date range.
-
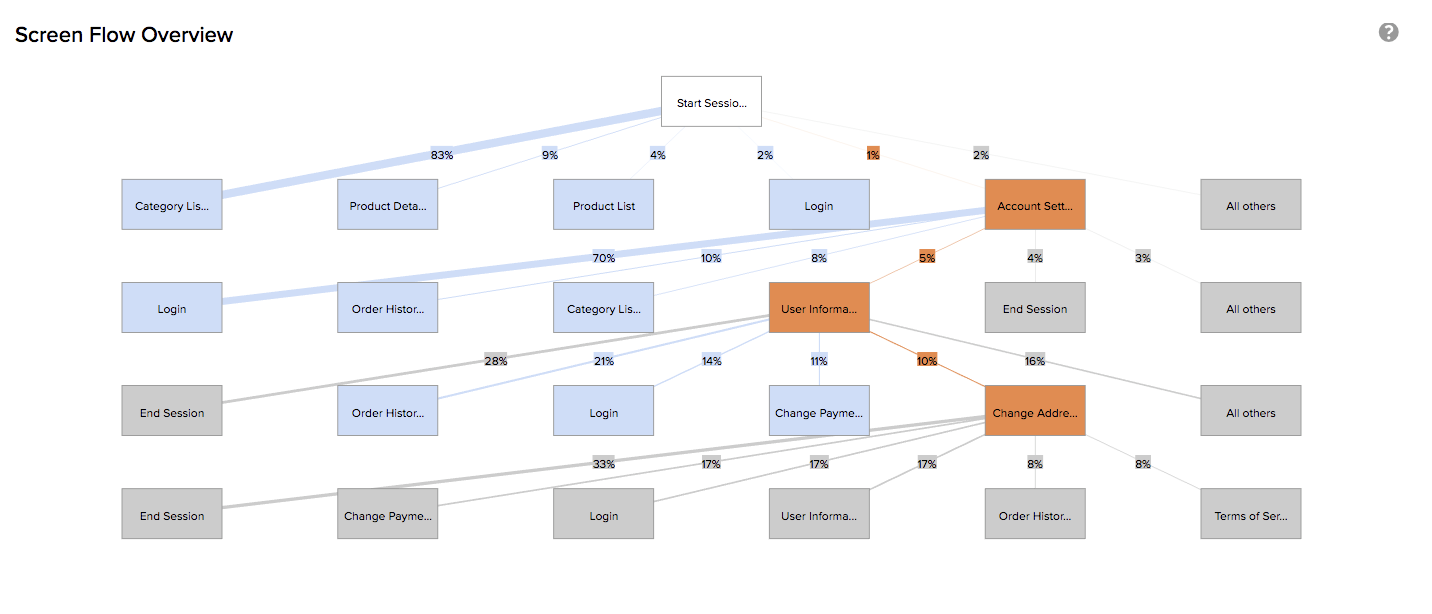
For a more detailed view, select any of the pathways.

You can view up to five screens deep.
Below the Screen Flow Overview, you'll see the Total Occurrences table, which lists all of the pages and screens in your app as recorded by the Screen feature, including the following information:
- Screen name
- Counts - total number of views
- Percent of users who reached the screen
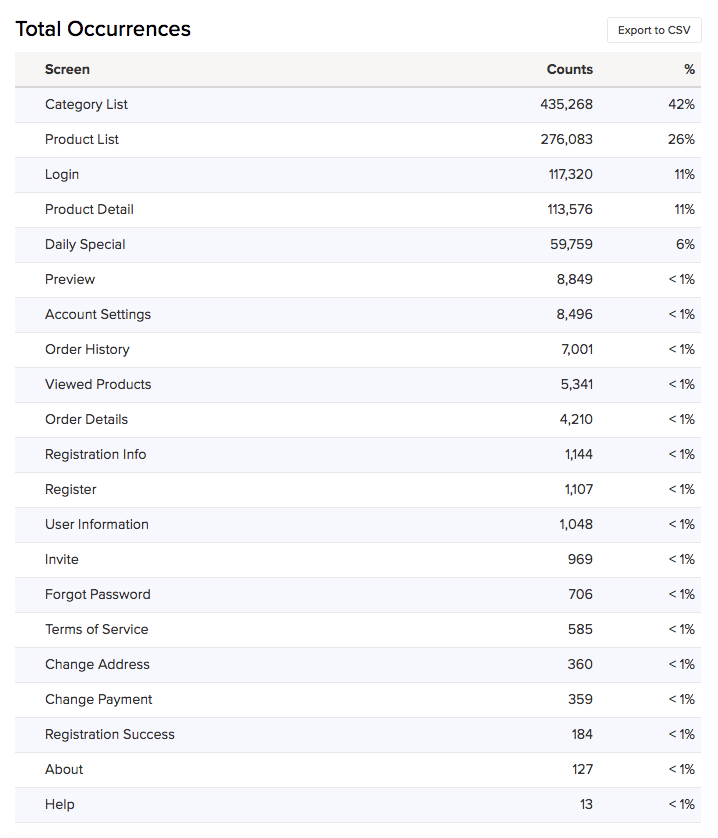
Note: To export data for further analysis, select Export to CSV.
-
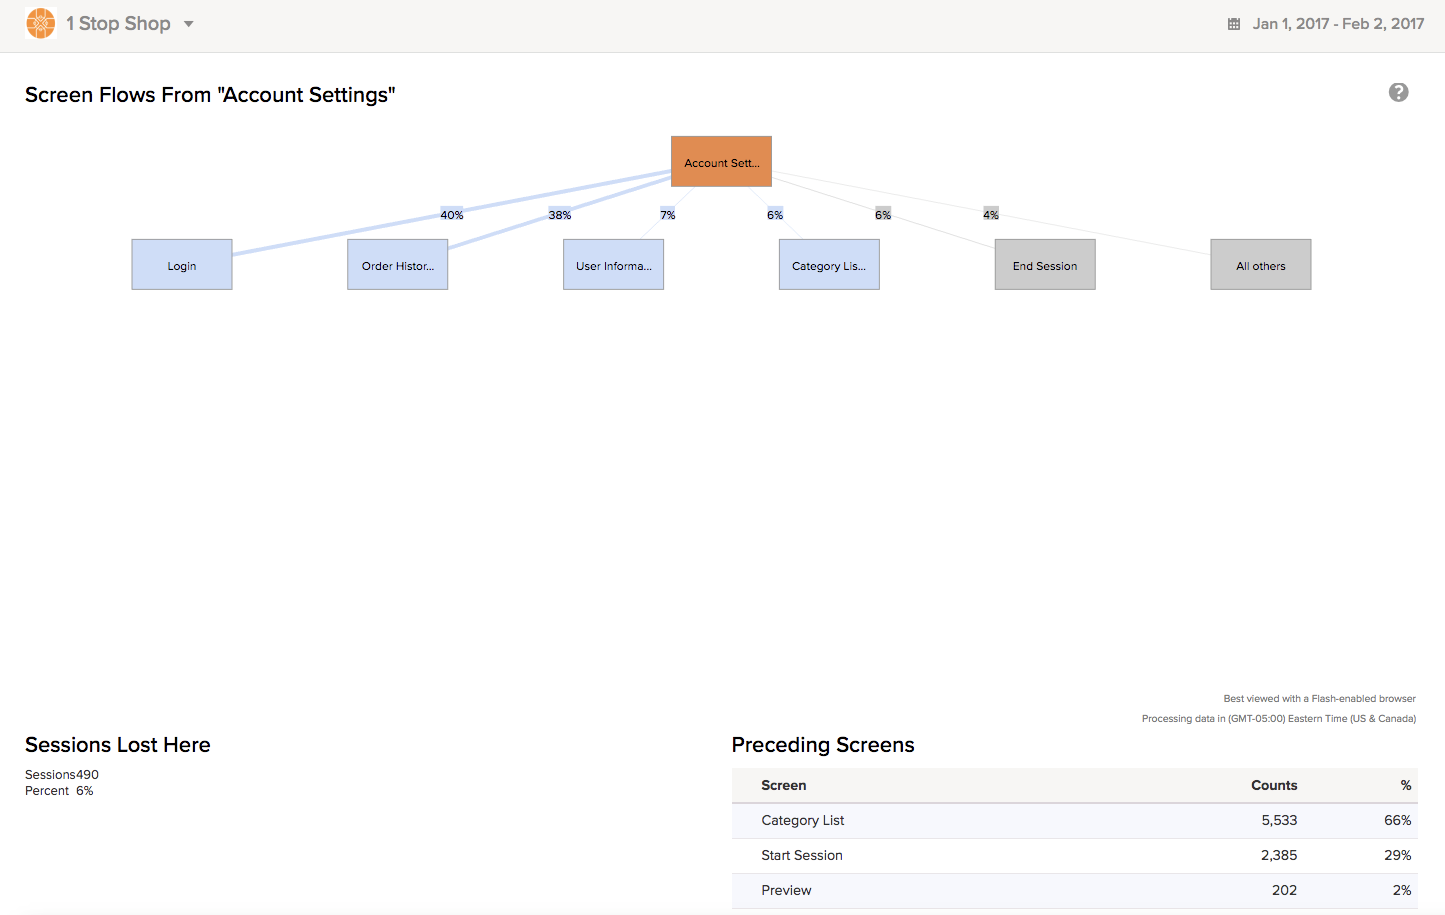
Select a screen name to see the breakdown of where users went from this screen along with the total number of sessions lost here on the screen and a list of preceding screens.
-
Next to the Total Occurrences table, you'll see a list of Exits By Screen table, which lists every screen in your app where a user exited, including the following information:
-
Screen name
- Counts - total number of users who exited from the screen
- Percent of exits from the screen
-
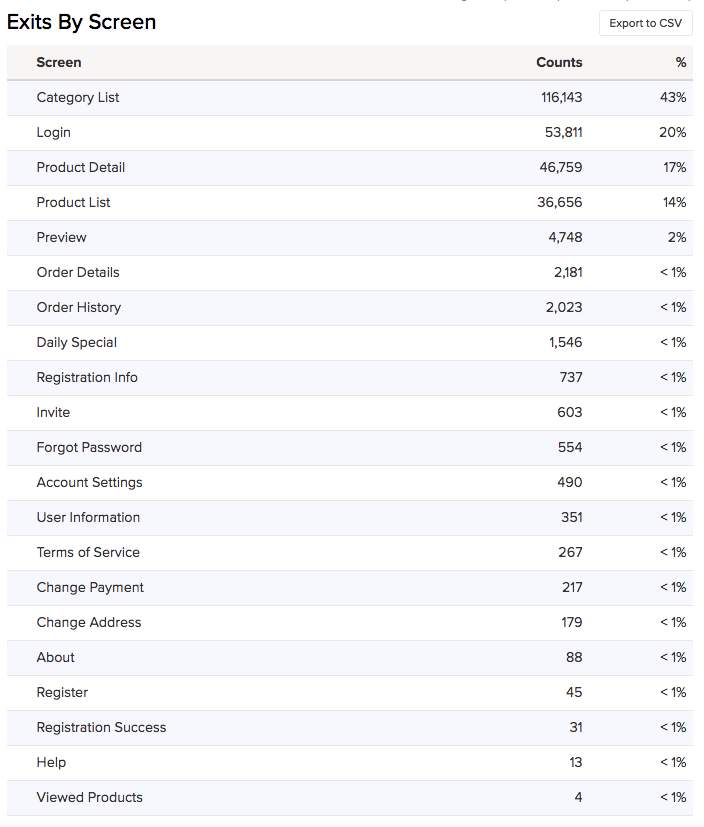
Note: Like the Total Occurrences, you can export this data for further analysis by selecting Export to CSV.
How to use the Flows report
You can use the Flows report to leverage a few different types of data. Consider using it to look for instances where a screen has a large number of sessions that end abruptly. This is a good indication of friction in key flows.
You should also look for loops in common paths. If users have to move between two screens many times, invest in making the process faster.