Funnels
For example, you could create a funnel for the following scenario:
- View a specific category
- View a specific product
- Add product to cart
- Proceed to checkout
- Purchase
The building blocks for funnels are your events. That is, every step in a funnel is represented by an event. Optionally, each step may be further analyzed by selecting specific attributes, dimensions, or custom dimensions.
In this topic:
Using the Funnels dashboard
To work with the Funnels dashboard:
-
Go to Analytics in the left pane and select Funnels.
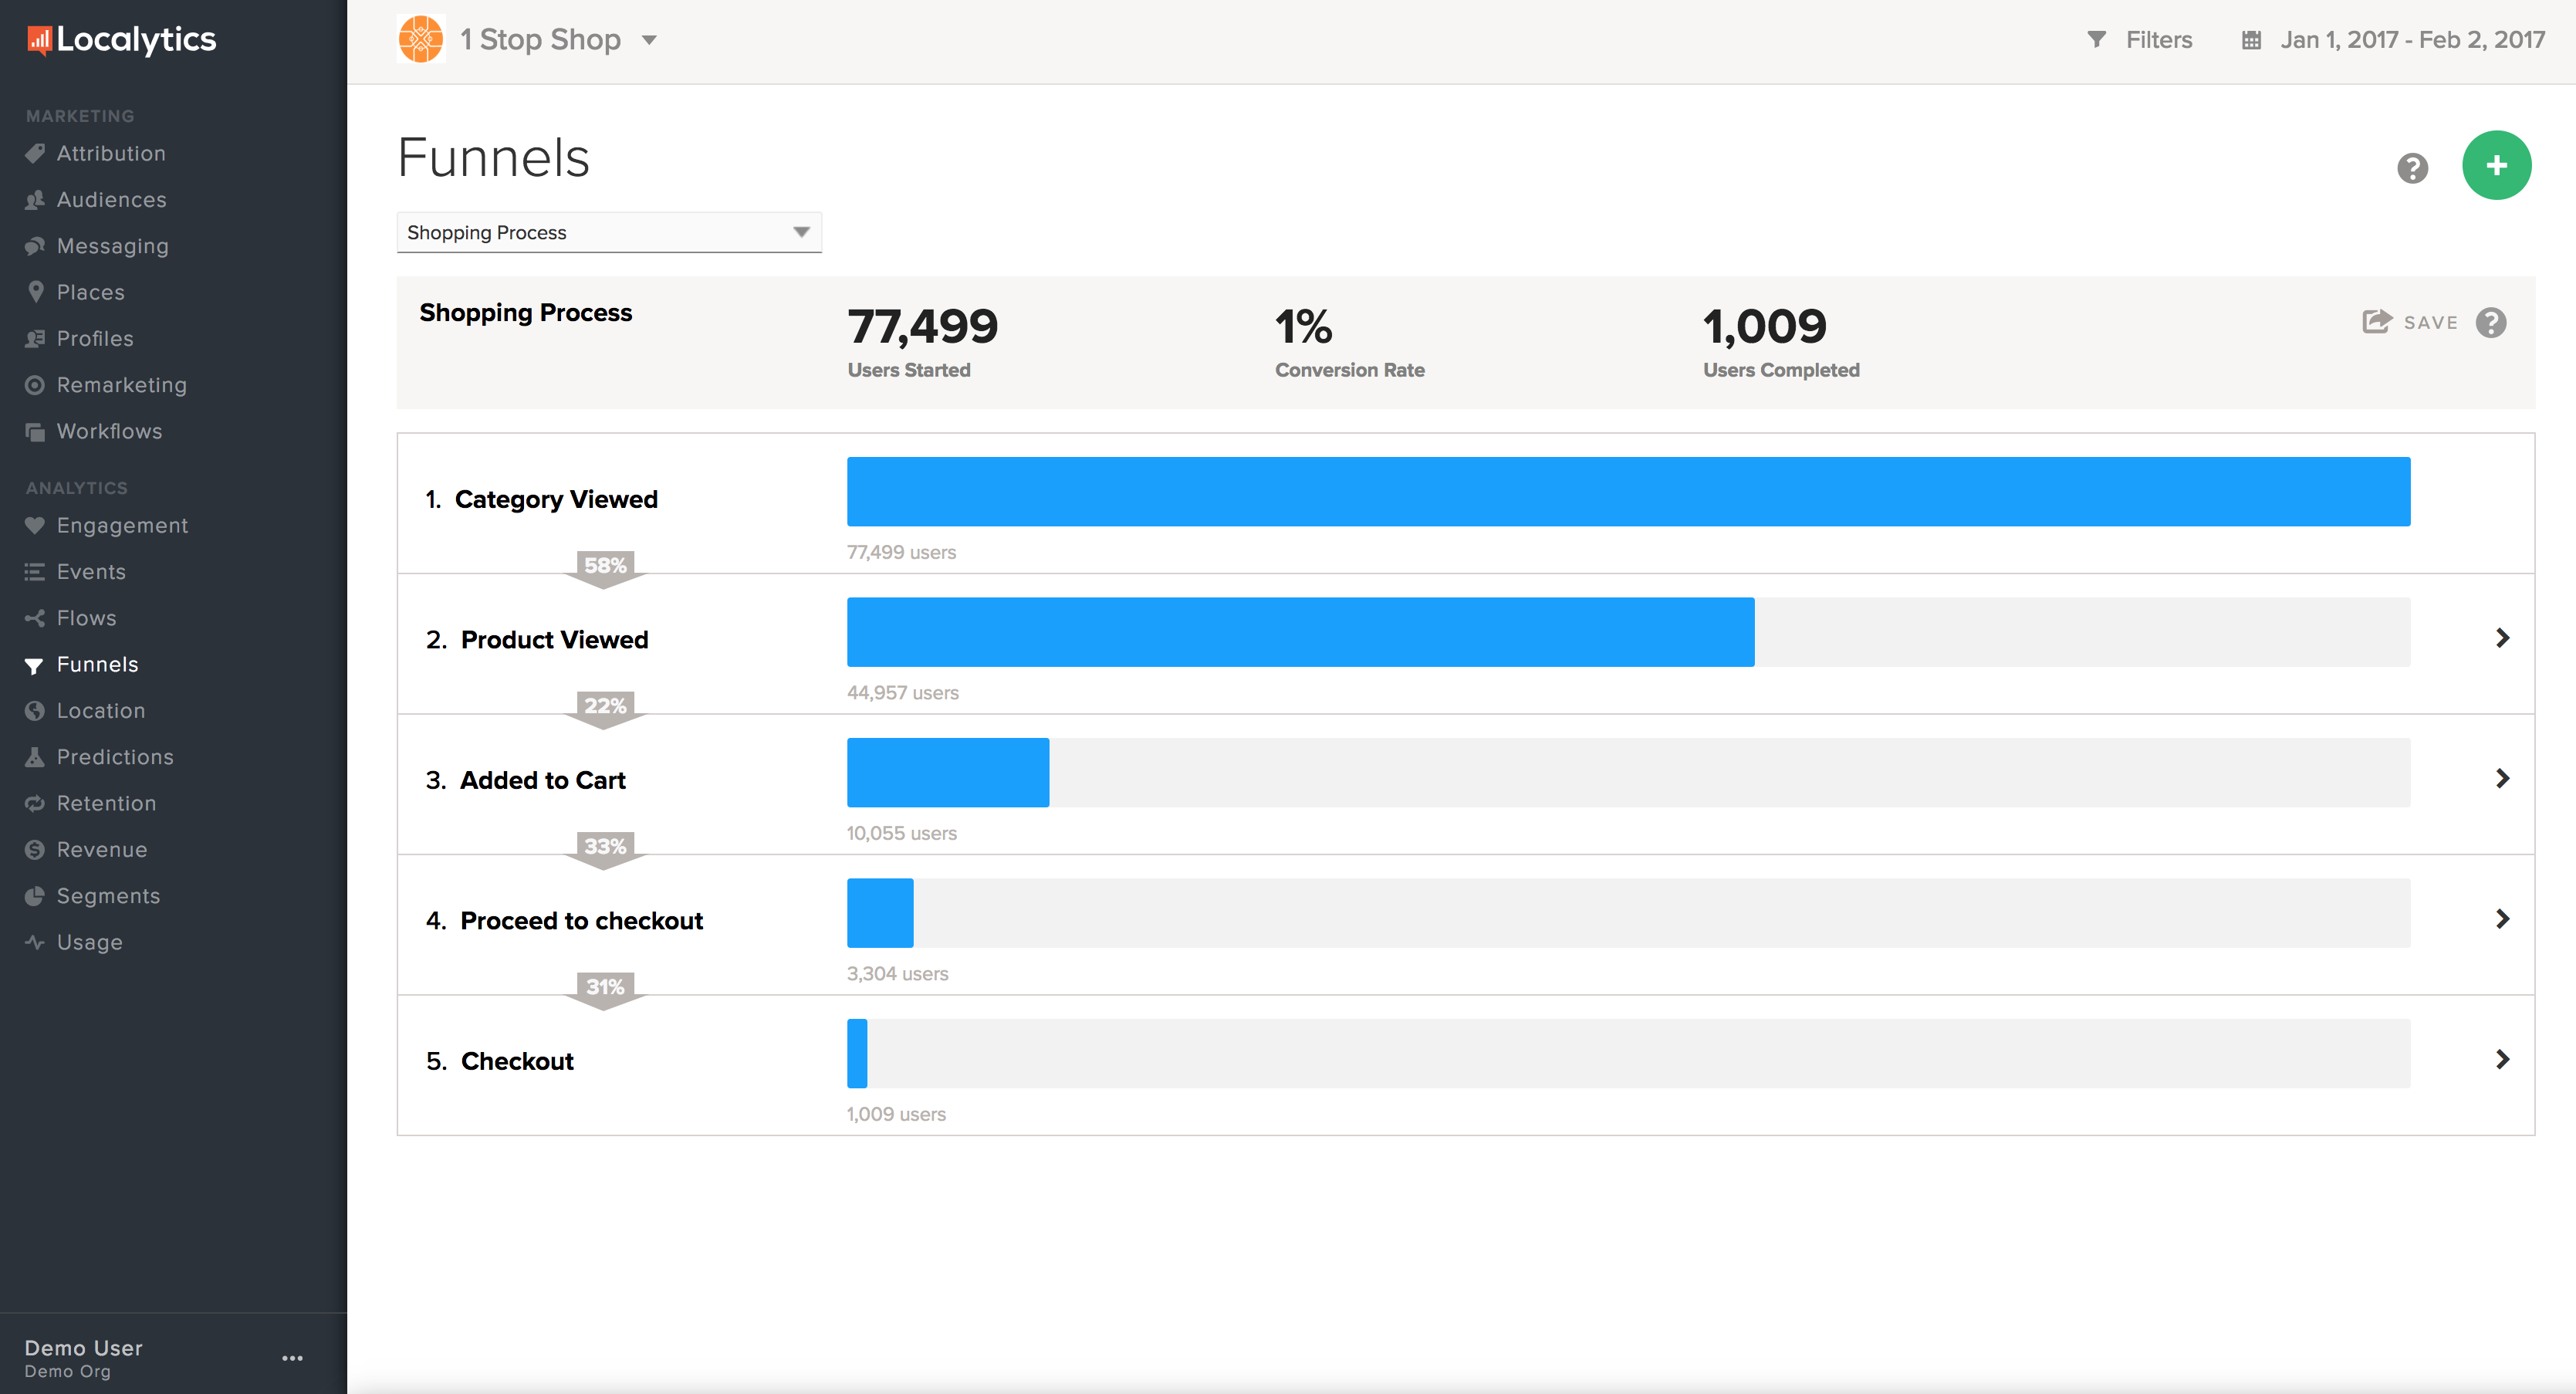
You see a high-level view of one of your funnels.
-
To switch to a different funnel, select the funnel name at the top of the page and then select a different funnel from the drop-down menu.
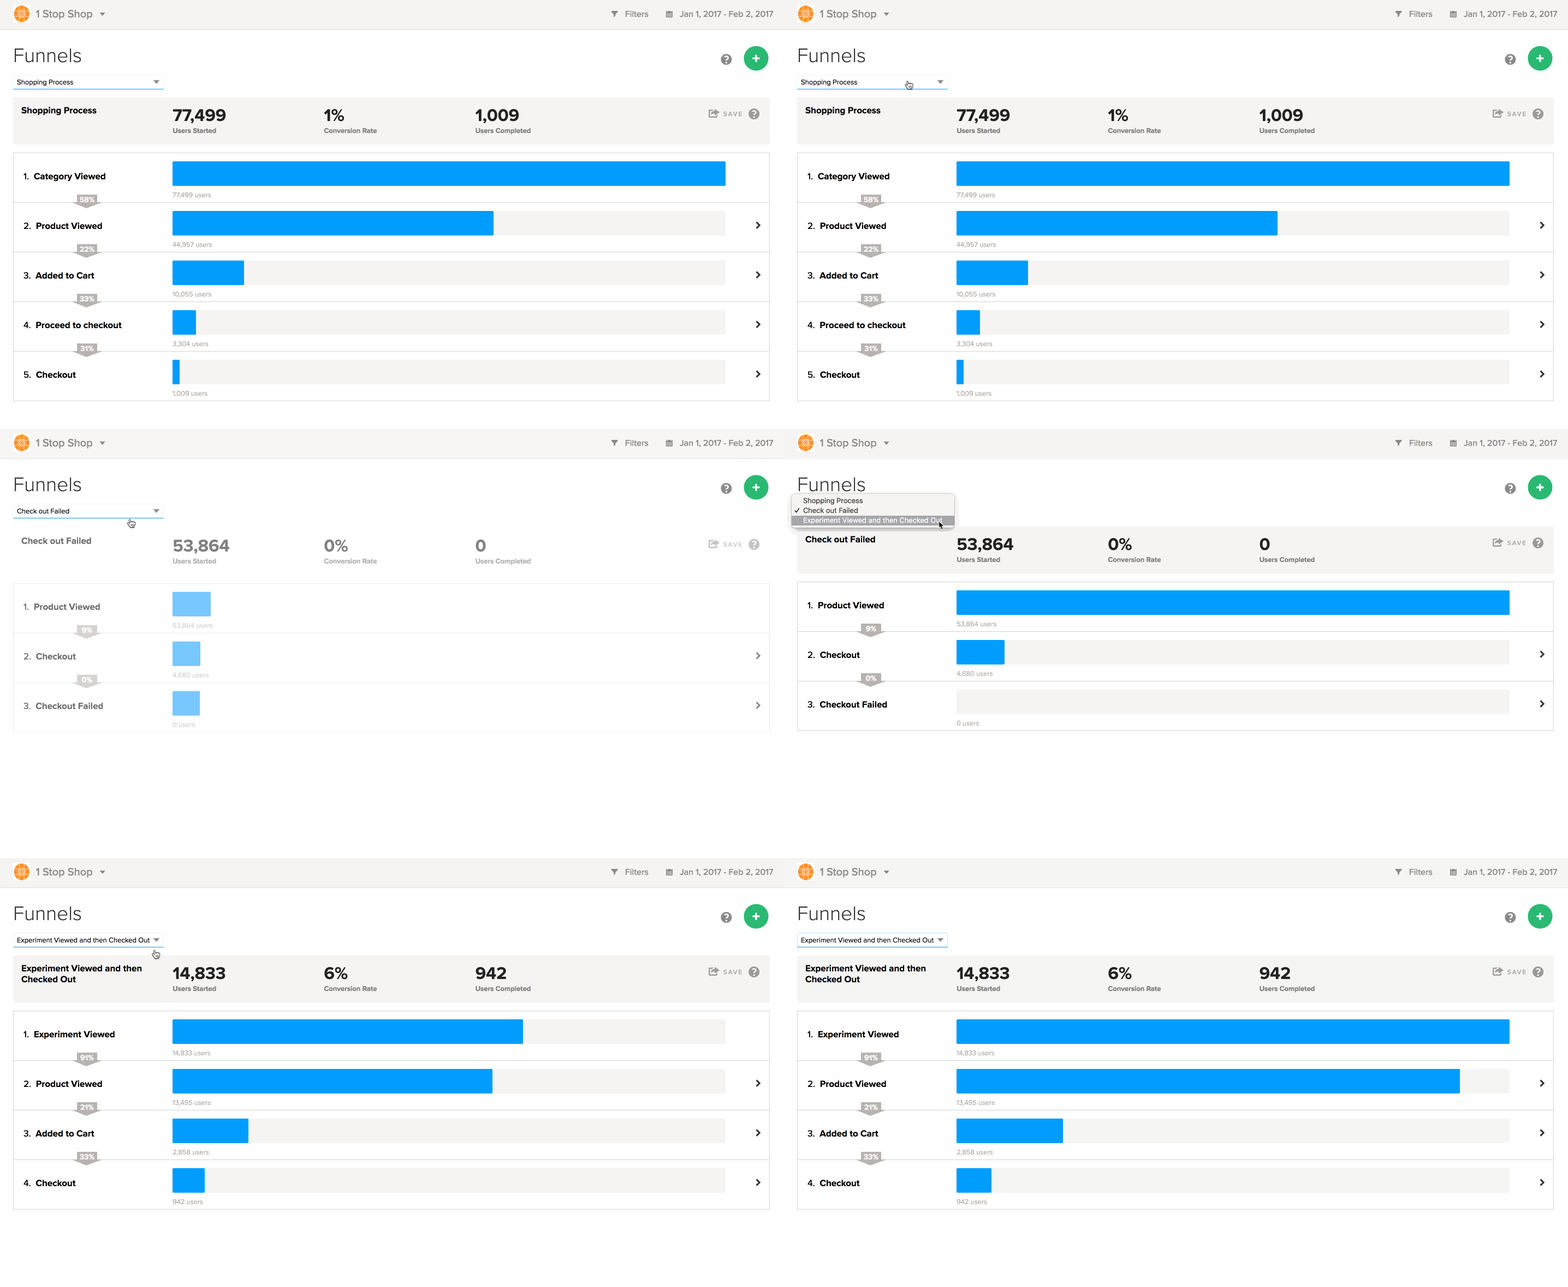
Like most analytics reports, you can filter by dimension and/or profile, set a date range, and save your report. To learn more about these features, see Anatomy of an Analytics report
Funnel rules
Localytics employs a few rules when building funnels, as follows:
| Rule |
Description |
|---|---|
| Chronology |
To complete a step in the funnel, a user has to perform that step's event after performing all the previous steps in the funnel. If a funnel is defined as A > B > C, then a user must perform A then B then C, (that is, A before B and B before C). |
| Sequencing |
Any number of events may occur in between steps in a funnel. Therefore, if a funnel is defined as A > B > C and a user performs A > B > D > E > F > C, then the user is still counted as having completed the funnel. |
| Session boundaries |
Funnels span sessions, so a registration funnel that takes three sessions over four days to complete is valid. So, for example, a user who adds an item to their cart in one session, and then completes the purchase several days later in a separate session, is still counted towards completing the funnel. |
| Date range |
All steps in the funnel must occur within the date range specified in the upper-right corner. Localytics only tracks the first time a user completes the funnel. If a user completes the same funnel multiple times within a specific date range, that user will not be counted a second time. |
Creating a new funnel
To create a funnel:
- Go to Analytics in the left pane and select Funnels.
-
In the upper-right corner, select the green
 button.
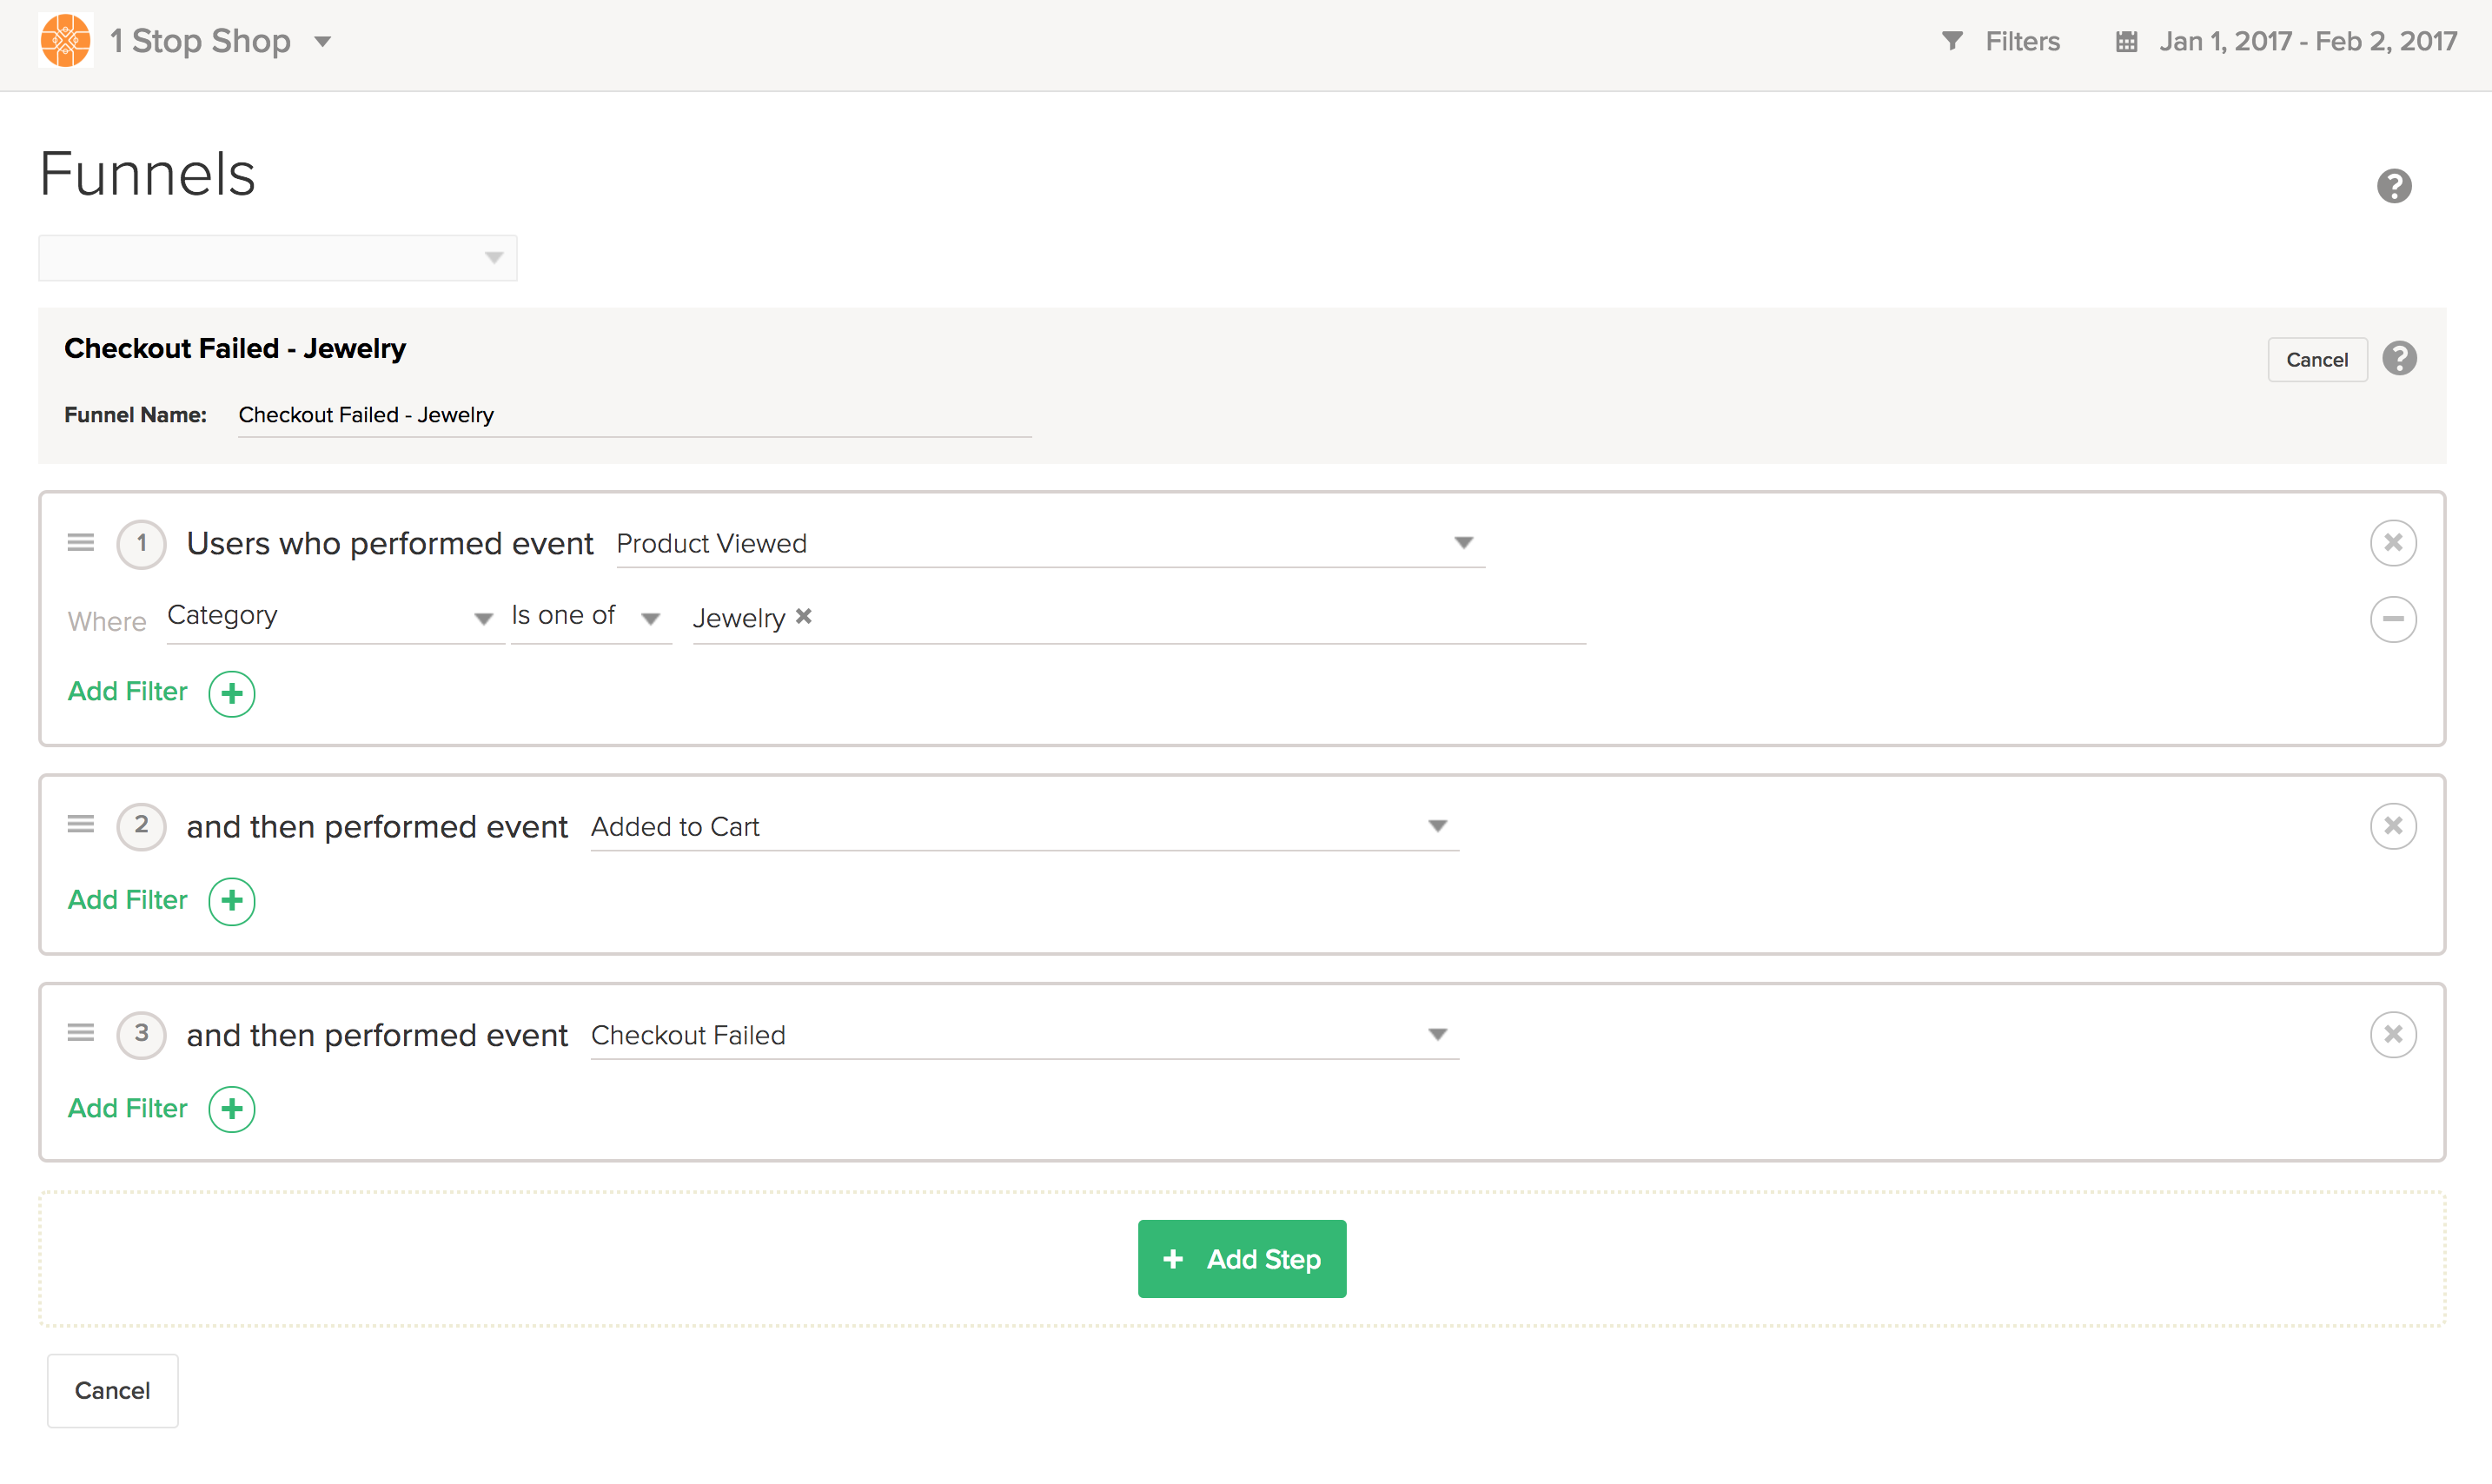
- In the Funnel Name field, enter a name for the new funnel.
- In the first step, select an event and any necessary attributes.
- Select + Add Step to continue adding events until the funnel is complete.
-
When you are done, select Save.
Localytics generates a report for your new funnel.
You can add up to 12 steps to a funnel, but it's best practice to keep them at around 5 steps. The more steps you have, the less likely it is that a user will take the exact path of your funnel.
Note: Funnels analyze users who performed the first action and then performed the subsequent action(s) in the order you specify. For example, users who viewed a particular category, then viewed a particular product, then added that product to their cart, and finally completed checkout.
Working with a Funnels report
-
Go to Analytics in the left pane and select Funnels.
Tip: To switch to another funnel, select the funnel name at the top of the page and then select a different funnel from the drop-down menu.
The Funnels report displays the steps for the selected funnel.
-
For more information and additional insights, select a step in the funnel.
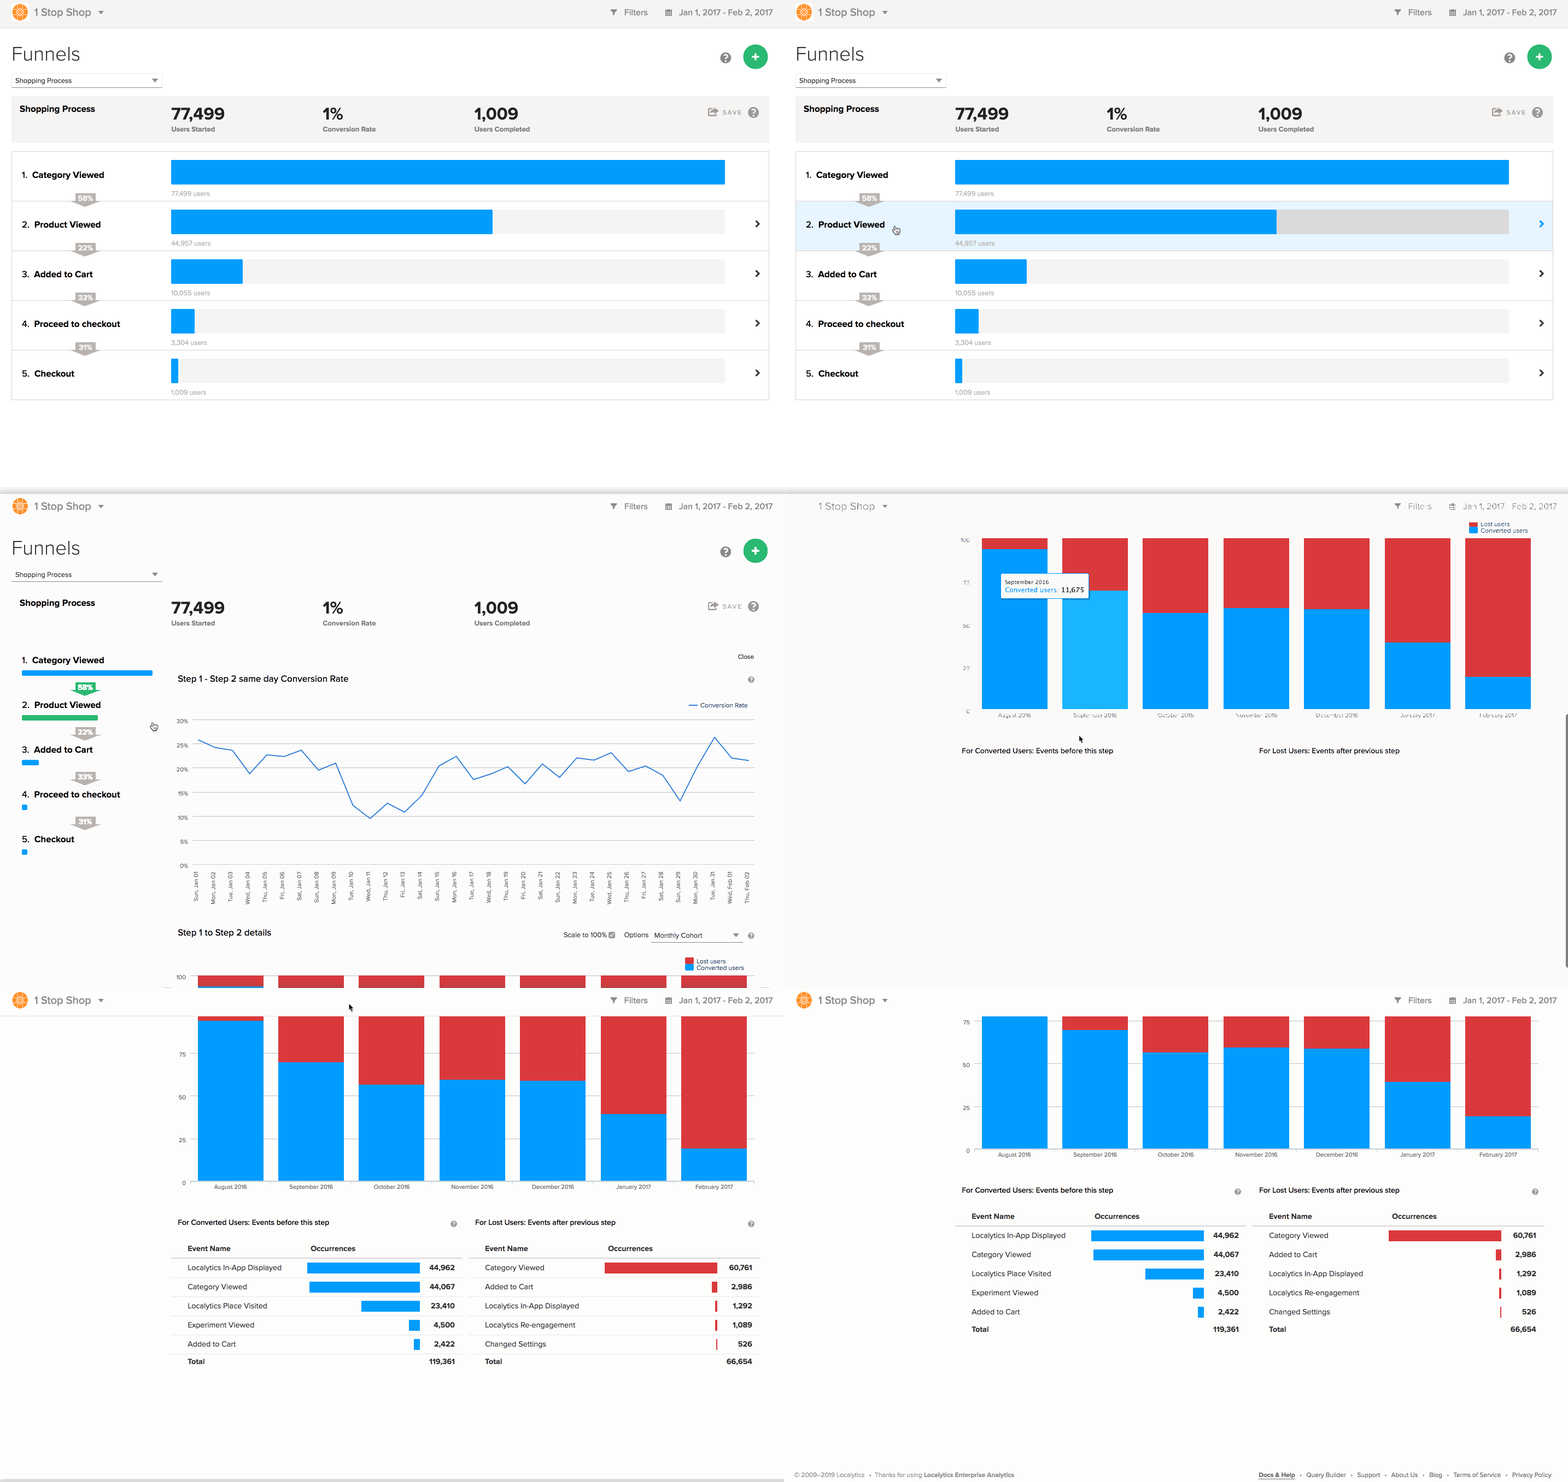
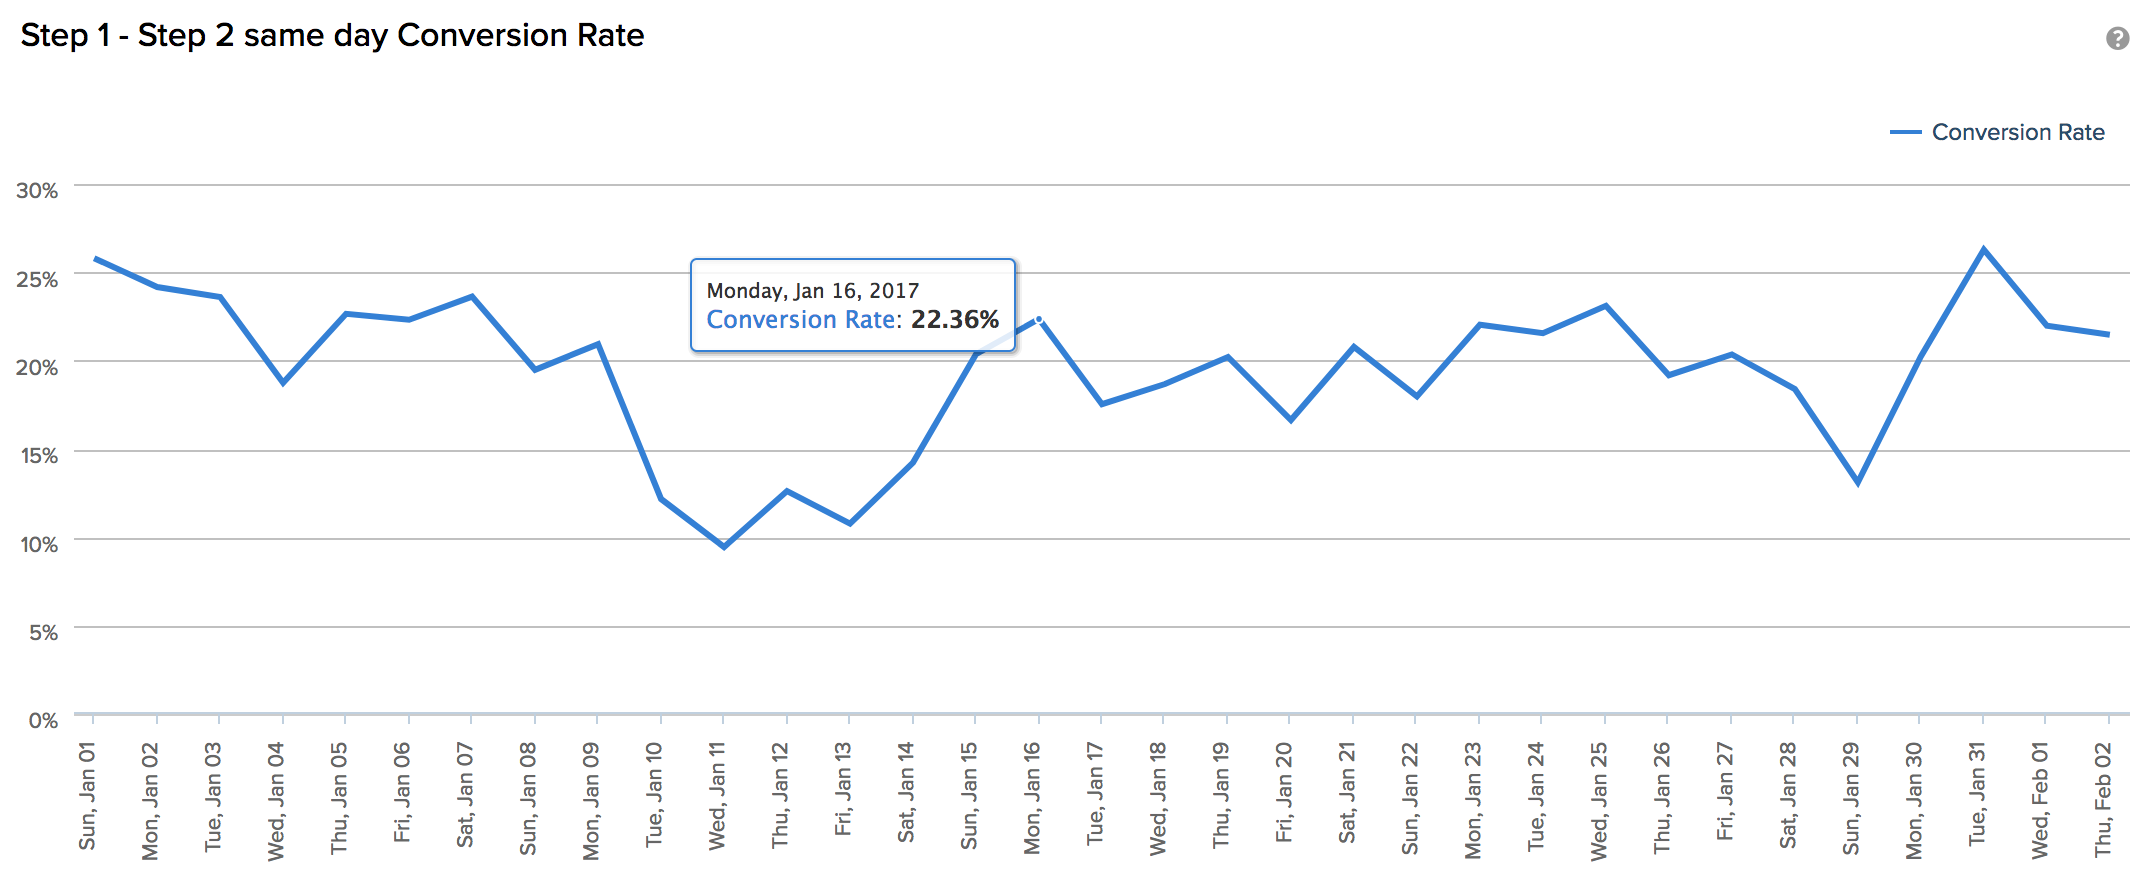
The first detailed view is the Same Day Conversion Rate chart. This reports the conversion rate from the previous step to the selected step for each day.
-
Point to any point on the graph to see a more detailed view of the conversion rate.;
Tip: Keep in mind, for a conversion to be counted, it must have happened on the same day as the previous step. Therefore, the number of occurrences on this chart may be less than the total conversions listed in the overview.
-
The Step [x] to Step [x] Details chart divides users into two groups:
- Blue users have successfully completed the current step in the funnel.
- Red users have failed to complete this step and, therefore, abandoned the funnel.
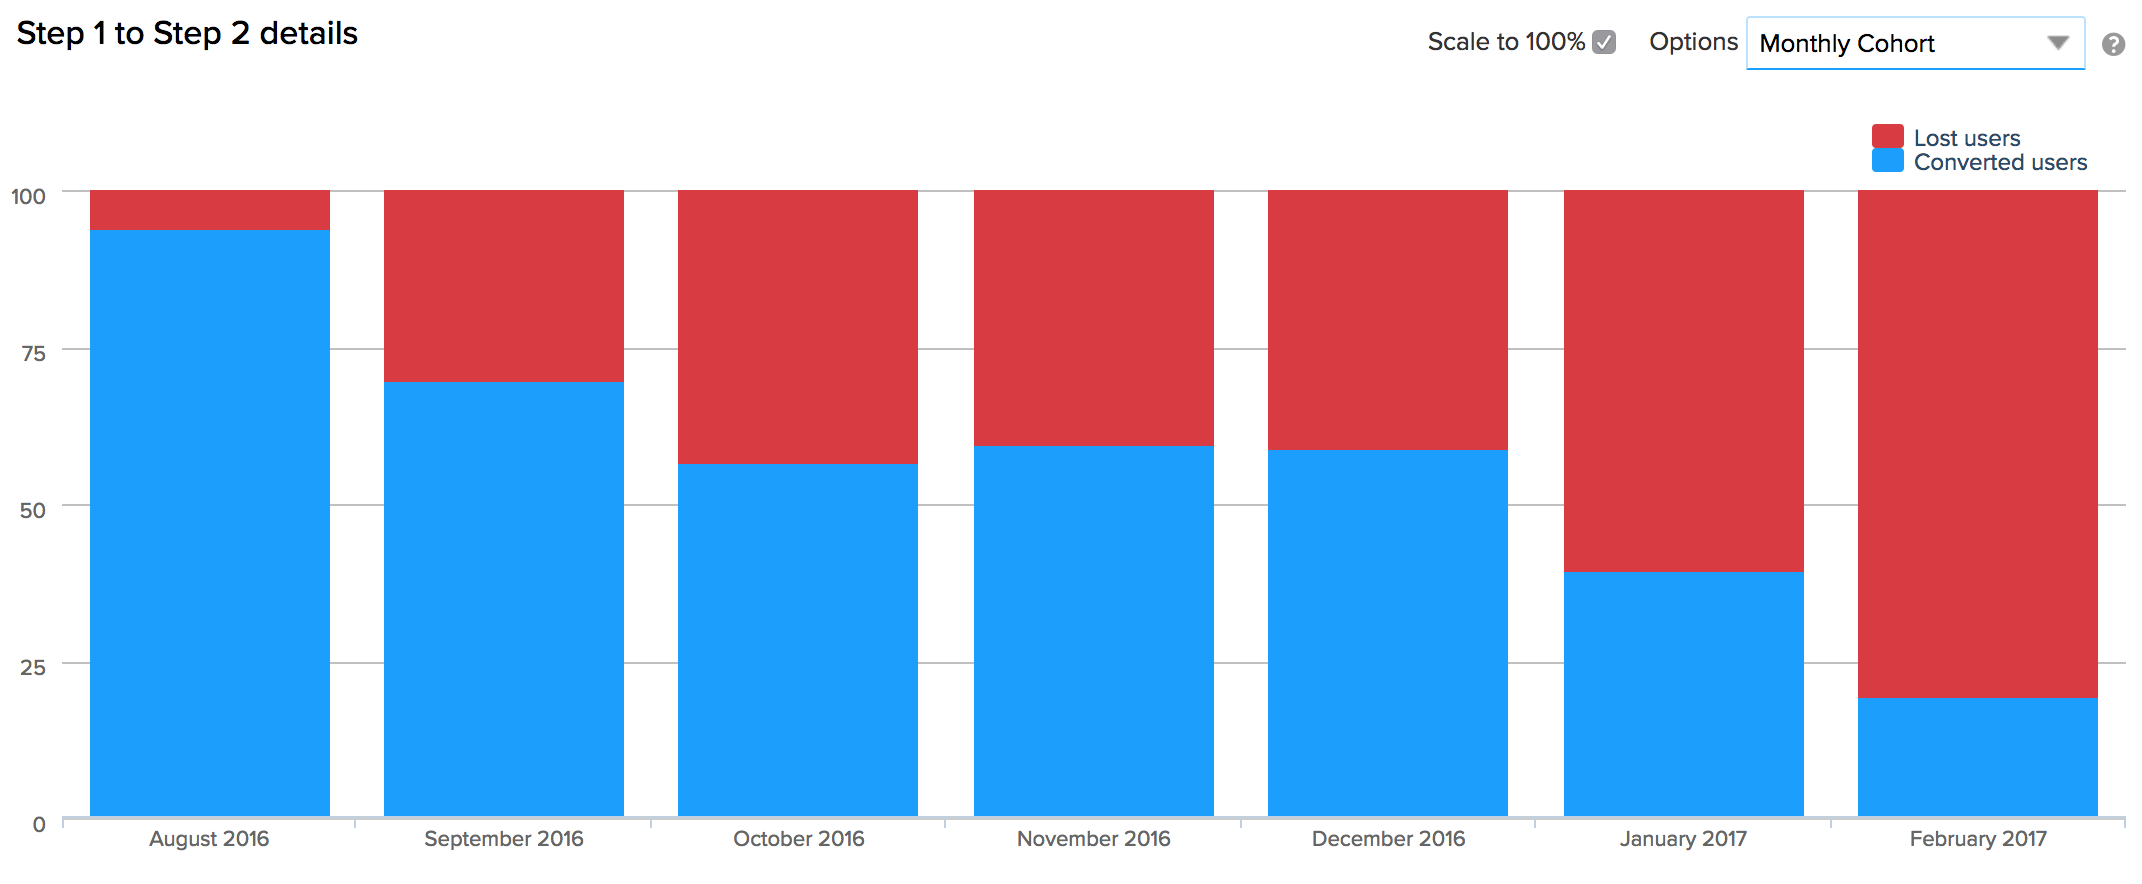
This defaults to reporting by Monthly Cohort, but the time range is adjustable.
-
The Converted Users & Lost Users charts identify the actions that precede conversion and abandonment, which may help to identify the behaviors that lead to successful conversion or abandonment.
.
