Predictions
Use prediction analytics to:
- Identify only those least likely to perform a conversion event so you can send them a discount to complete the sale.
- Discover key behaviors that indicate retention and loyalty, such as the number of referrals a user makes.
- Identify users at high risk of churn so you can send them offers and messaging to rekindle interest.
There are two key marketing events you can predict:
-
Conversion predictions forecast user action. They tell you when users are most likely to perform key conversion events, such as view products, make referrals, or finish a checkout.
With conversion predictions, you can predict when users are likely to convert and send them promotional messaging that pushes them to take action.
- Churn predictions forecast user inaction. It's typically an indication of users who are likely to disengage from you. You want to know churn predictions so you can anticipate and prevent user disengagement by sending marketing messaging that reignites their interest and keeps them coming back.
In this topic:
Using the Predictions dashboard
To work with the Predictions dashboard:
-
Go to Analytics in the left pane and select Predictions.
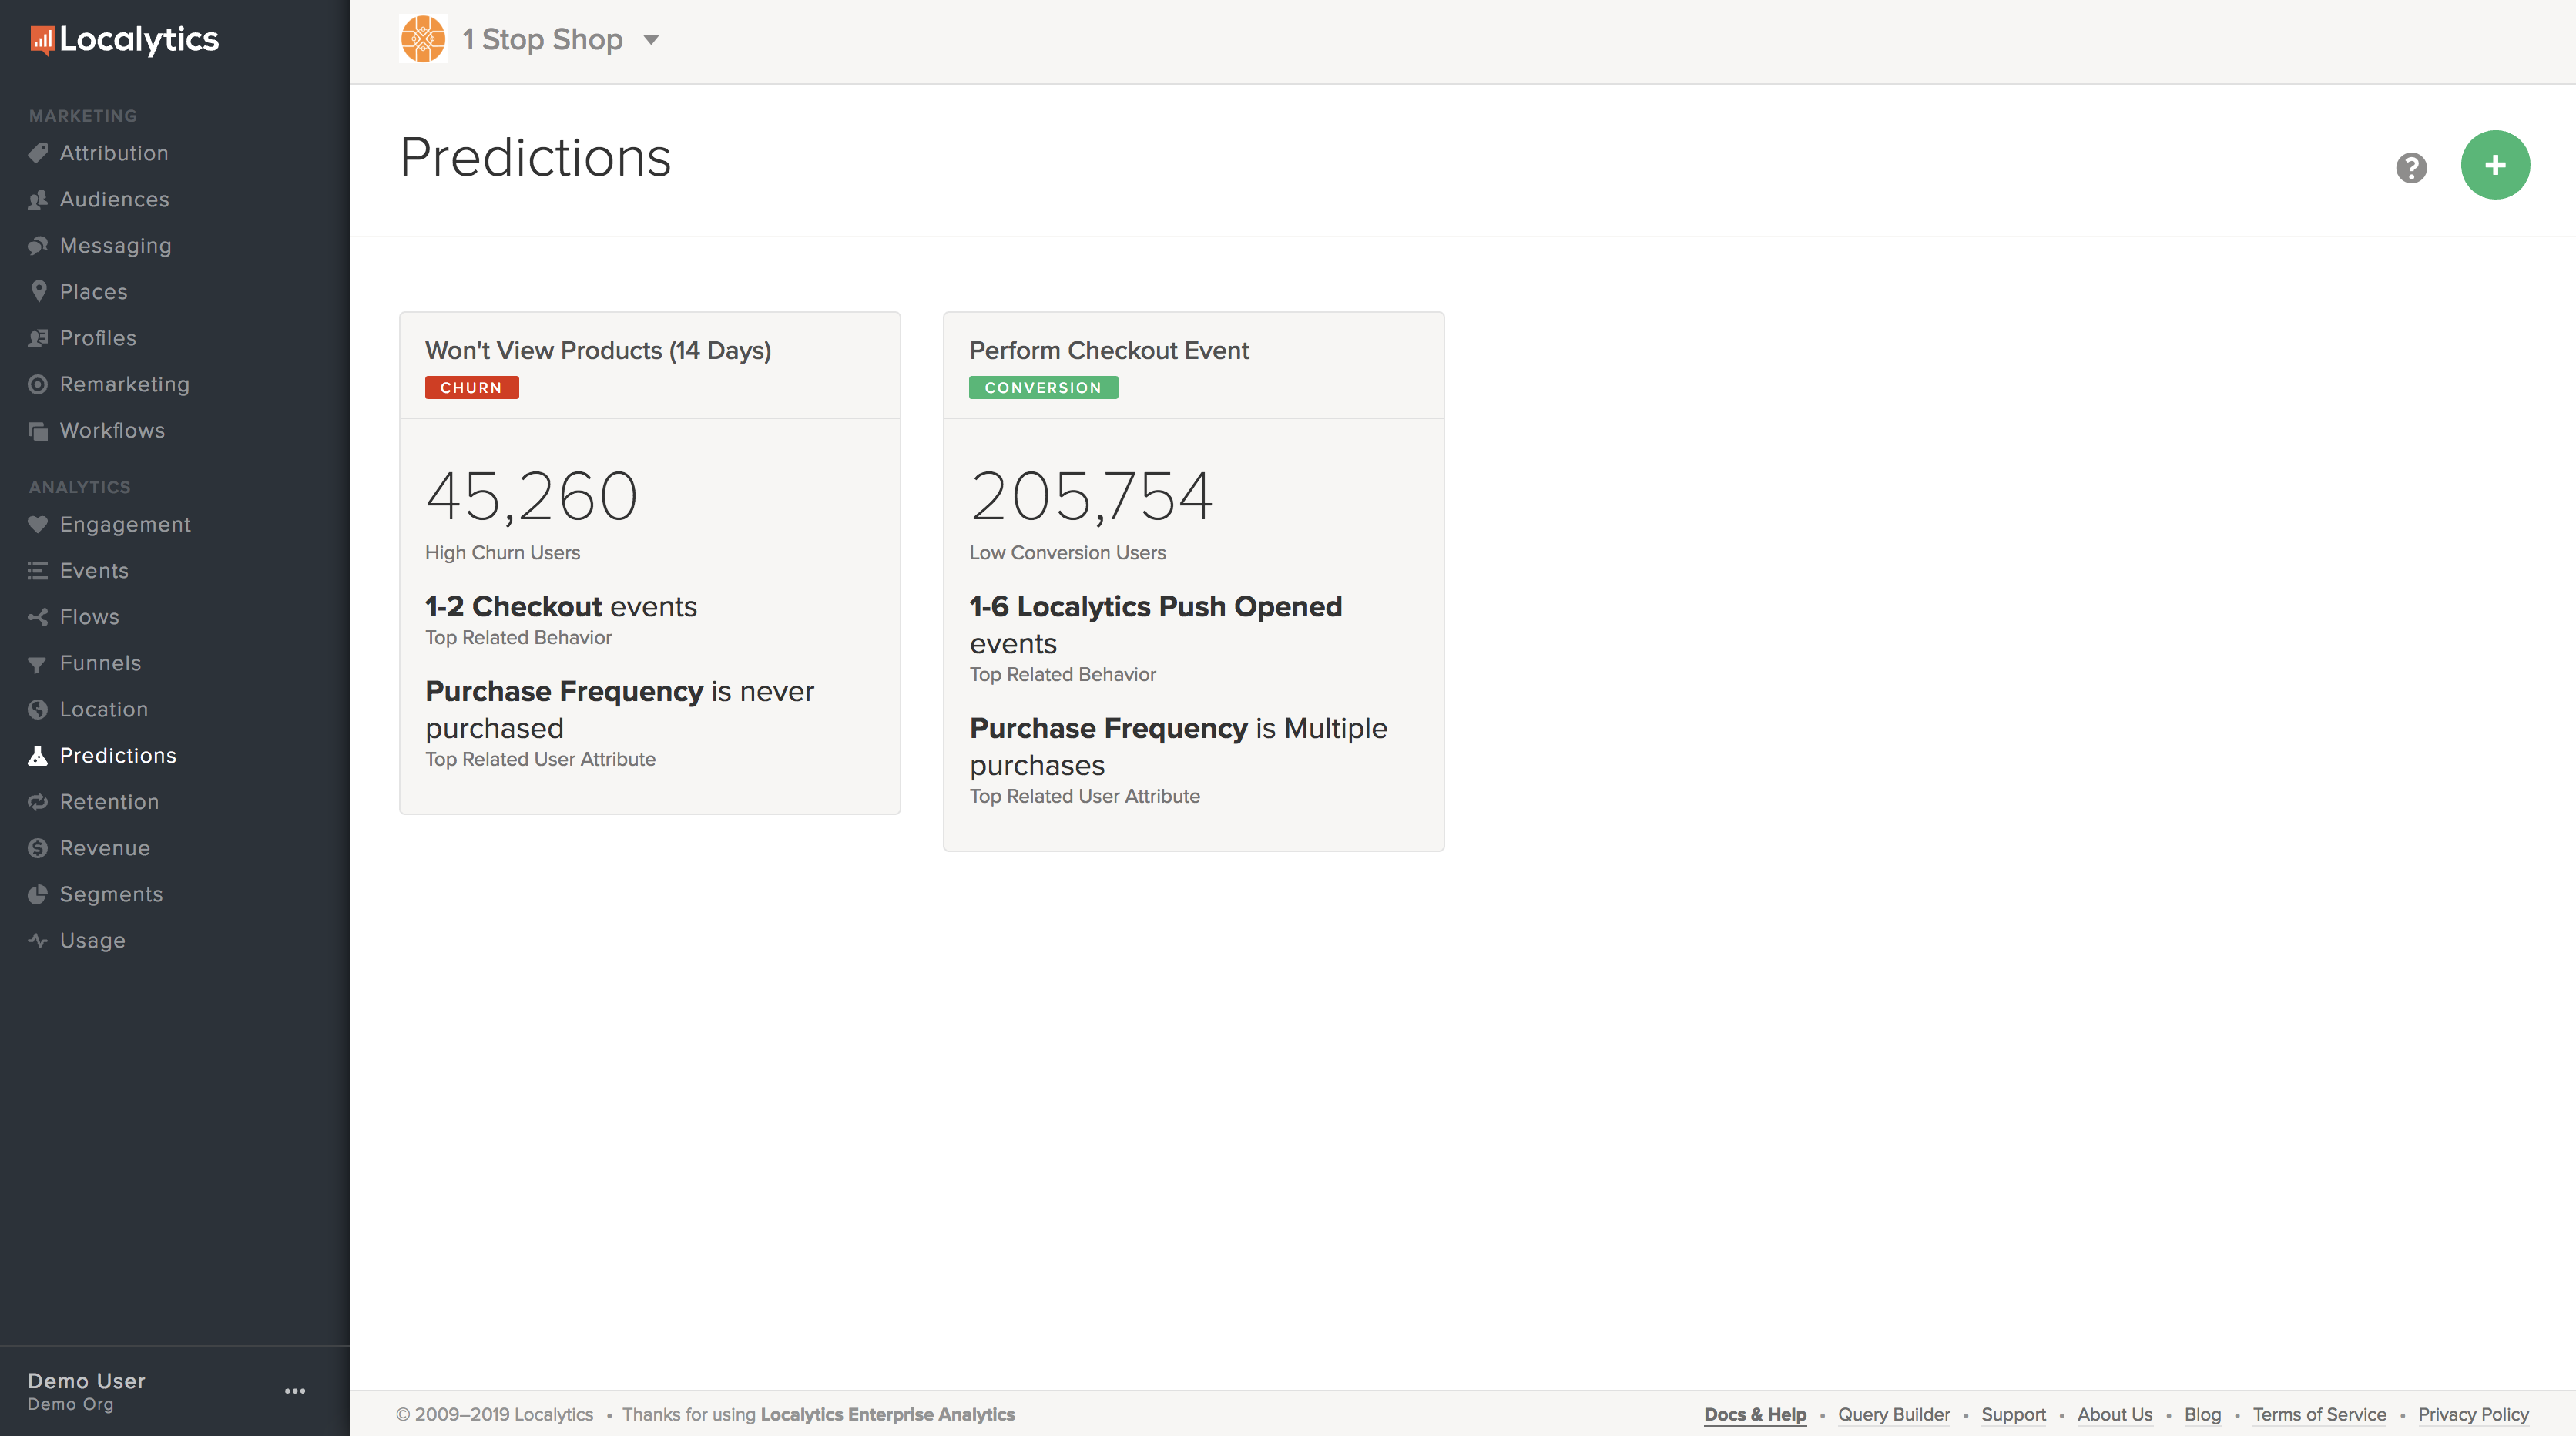
The Predictions dashboard contains a tile for each available prediction.
- Select a tile to see the details of a prediction. For more information, see Using Predictions reports.
- To return, select Back to Predictions in the upper-left corner.
Creating a new prediction
To create a new prediction:
- Go to Analytics in the left pane and select Predictions.
-
In the upper-right corner, select the green
 button.
 -
Select churn or conversion.
- Churn predictions forecast users whose inaction indicate that they are in danger of leaving the app.
- Conversion predictions forecast users whose actions indicate that they are likely to take further action.
-
Select the event(s) that will fulfill the prediction:
-
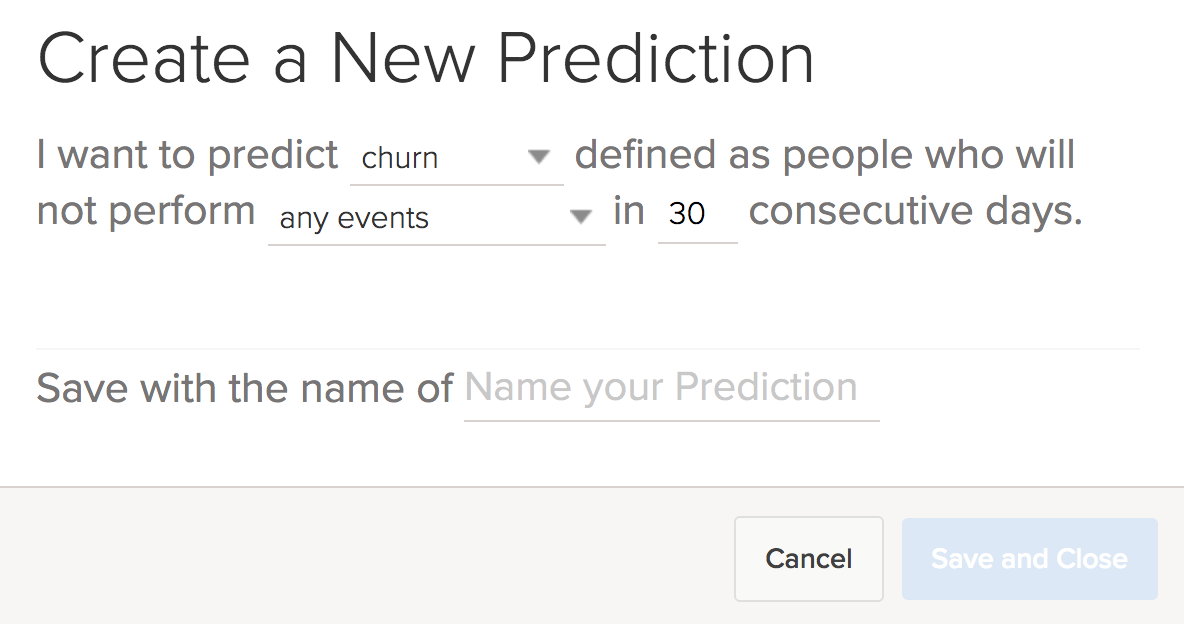
For churn predictions, select the events or actions the user is not likely to take. Select any events to monitor all events, or select the following events and then select one or more events to monitor. Then select a time frame from 7 to 90 days.
-
For conversion predictions, select one or more events or actions that the user is likely to take.
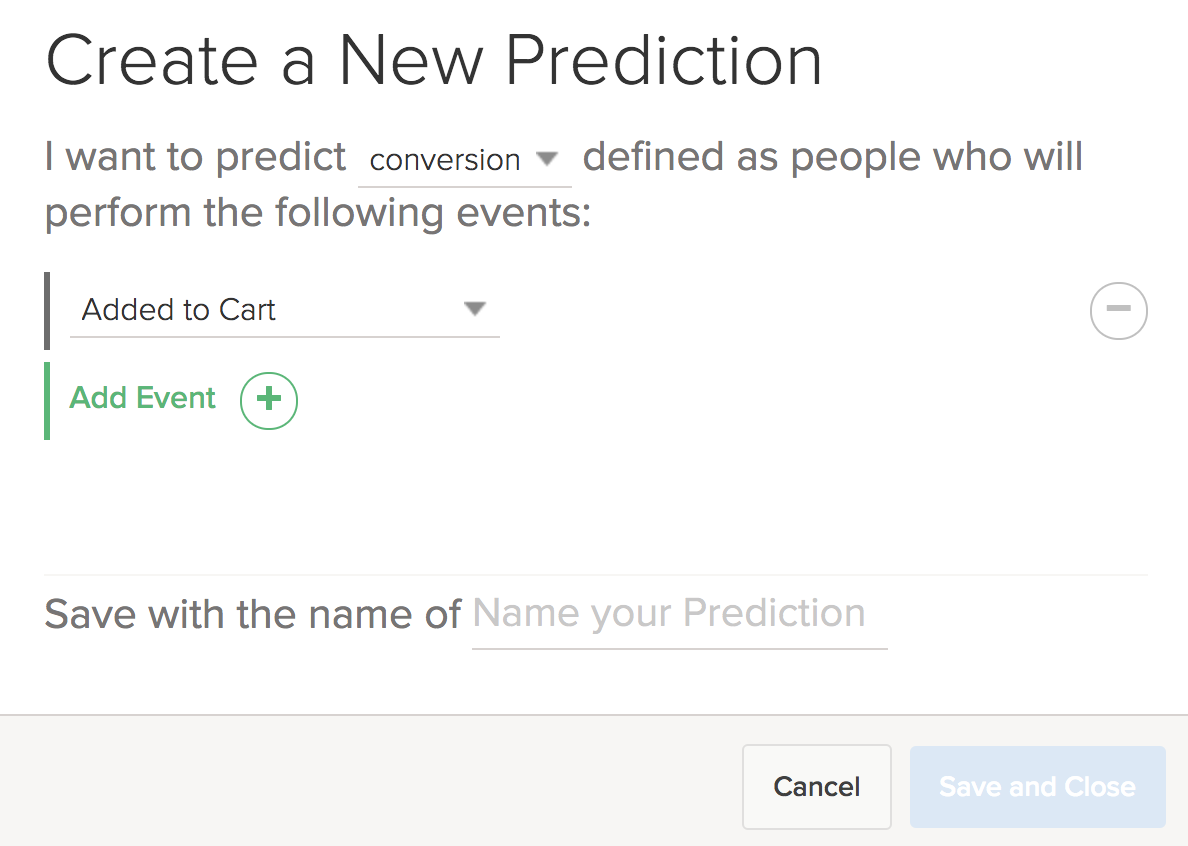
Tip: Choosing multiple events helps you to refine both churn and conversion predictions and tailor your marketing to the expected user behaviors.
-
-
Add a descriptive name for the prediction.
Note: We recommend naming your prediction by describing the type of user behavior you intend to forecast. This will help avoid confusion later on and will allow you and your team to more easily interpret and use new predictions as more are created. For example, a good name for the churn prediction is "Churn - no events in 30 days."
- When you are done, select Save and Close.
Our predictions are programmed to use the most recent data possible, so we wait until midnight ET to generate them. They are then updated automatically every week to reflect changes in user data and trends.
Using Predictions reports
Predictions reports can help to shape more effective marketing strategies and campaign messaging and offers, for example:
- For users highly unlikely to view a product within 30 days, send a time-sensitive offer to entice interest before then.
- For users who are multiple purchasers, reward their loyalty with an offer to purchase before the general market.
Predictive reports can also help you identify the ideal time to send your marketing message. Certain behaviorial attributes can indicate when certain users are more likely to open push messaging and even on which device types.
To access an individual Predictions report:
-
Go to Analytics in the left pane and select Predictions.
The Predictions dashboard contains a tile for each available prediction.
-
Select a tile to see the Prediction report.
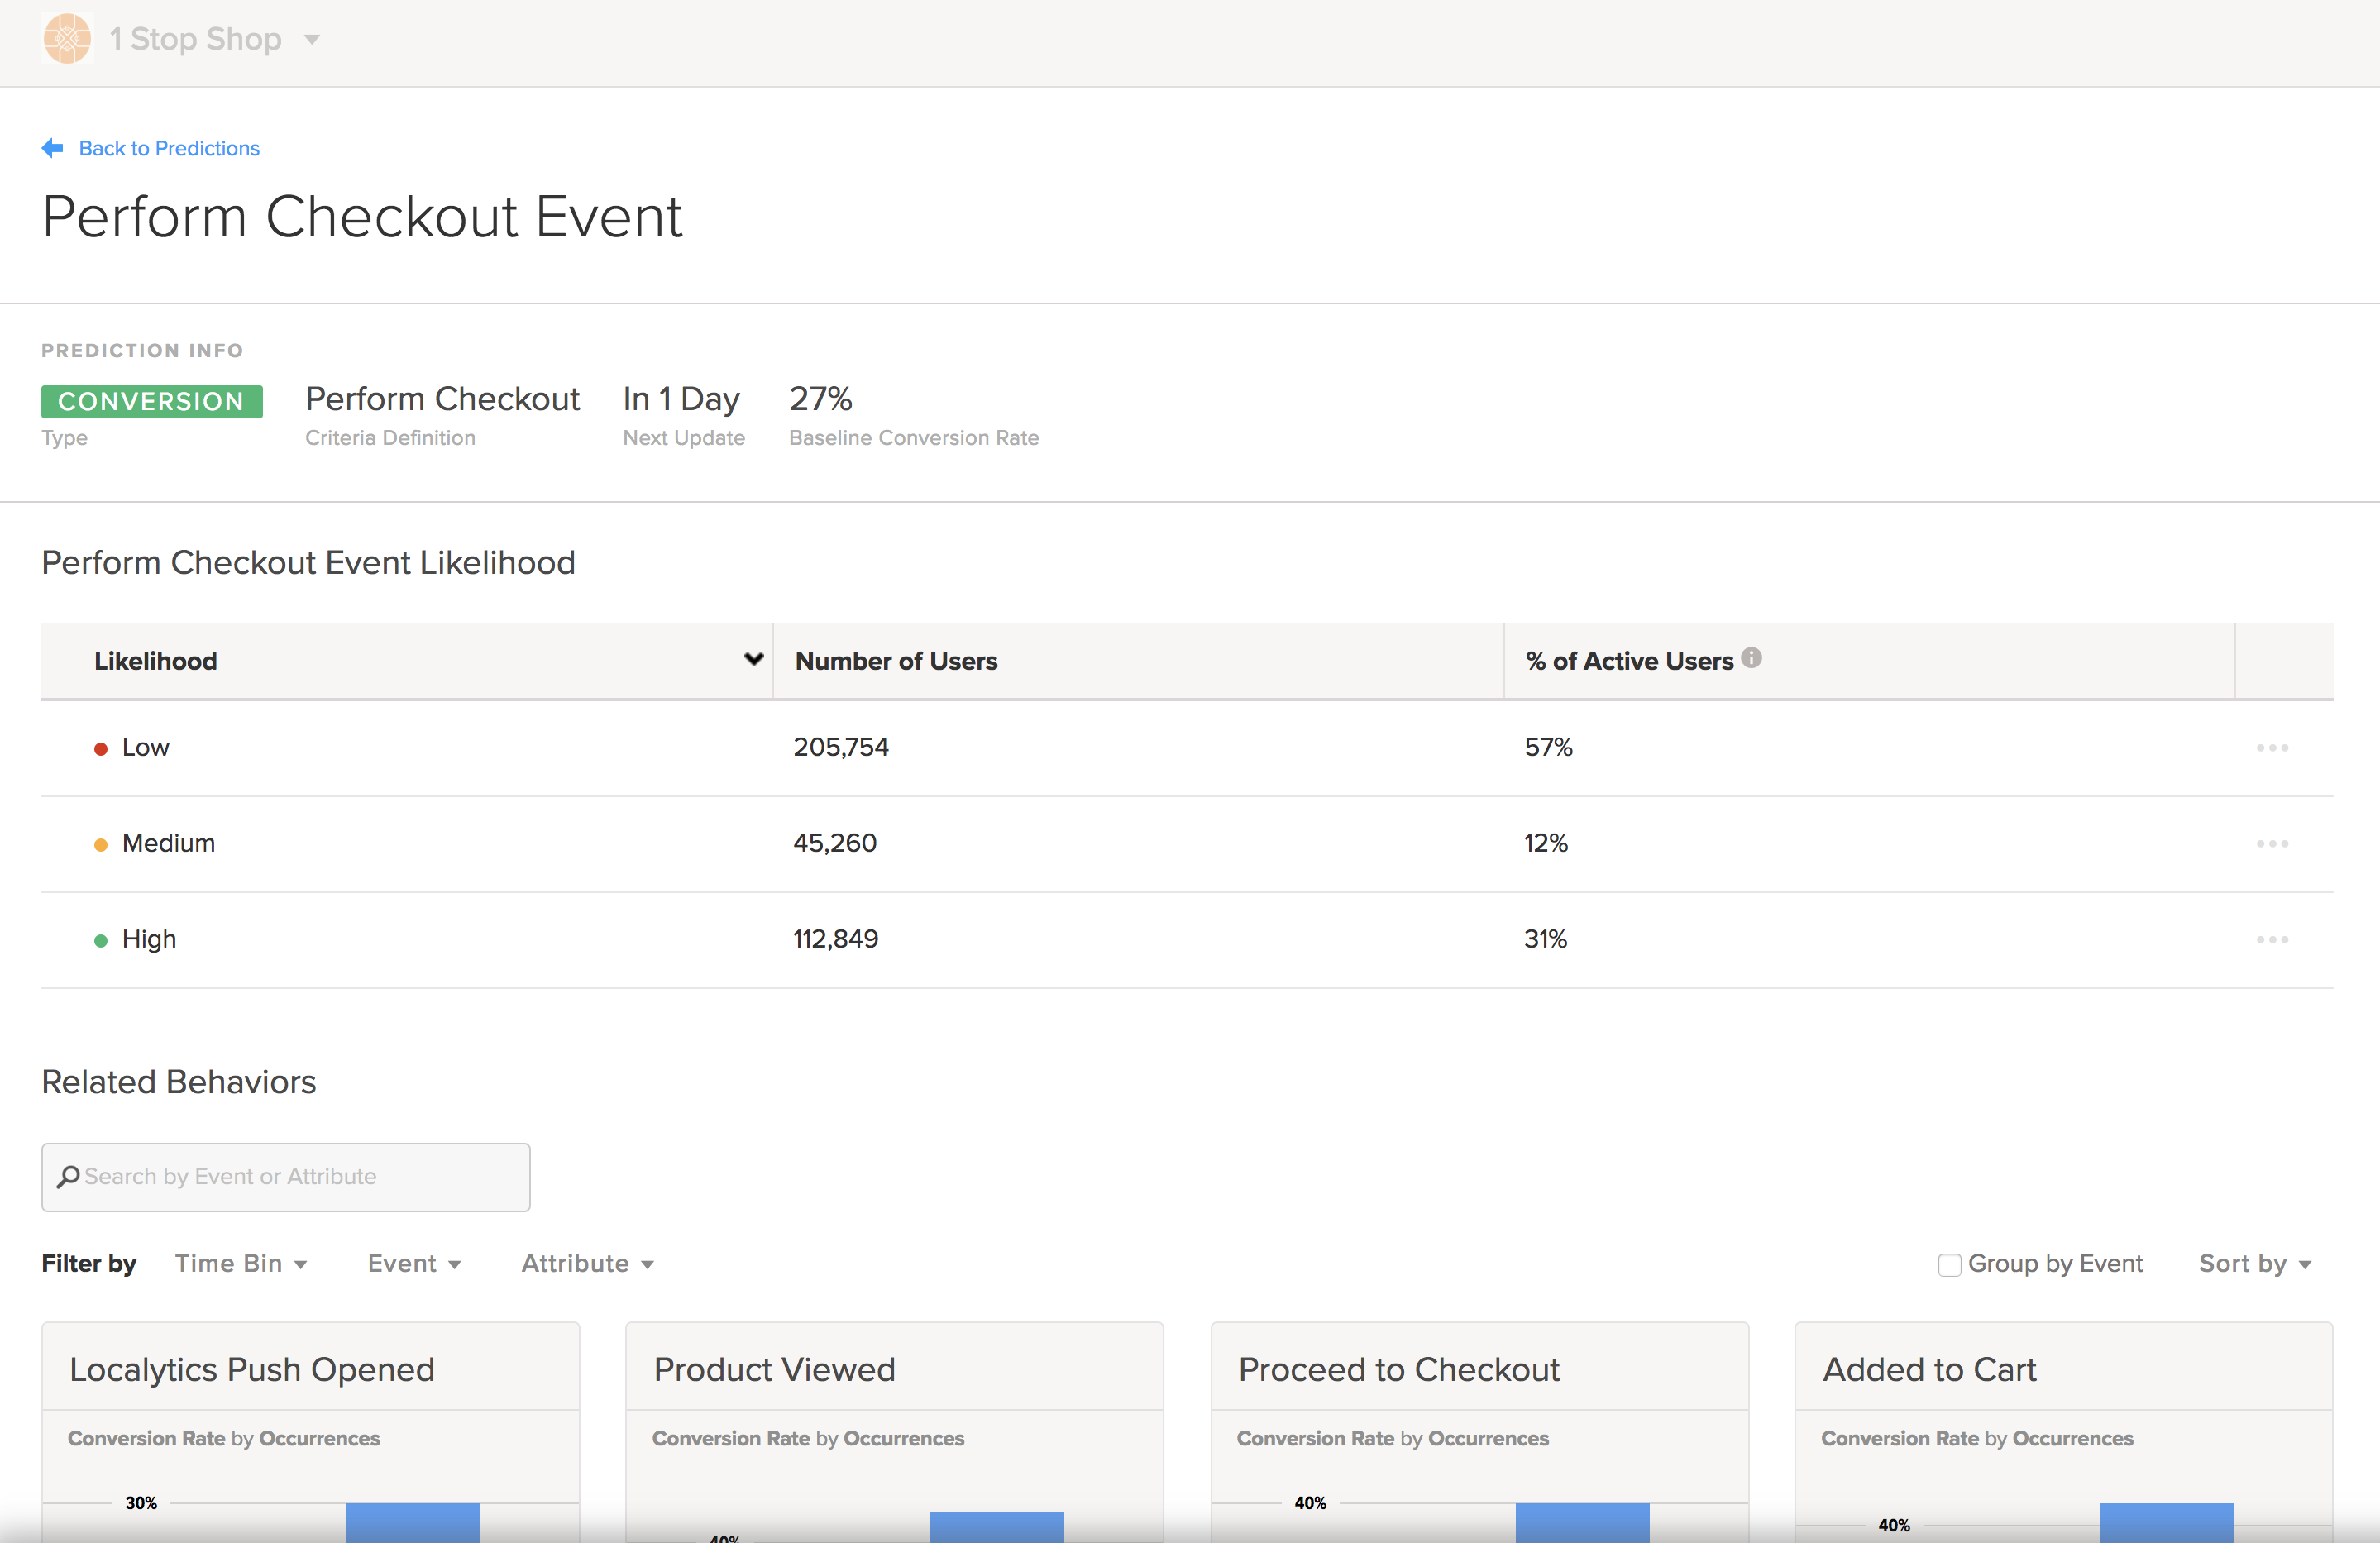
The Predictions report displays all of the data Localytics has for your current prediction. The Prediction info sections summarizes the type of prediction, criteria definition, next update, and baseline conversion rate.
-
Review the Likelihood table, which rates users as low, medium, or high likelihood to fulfill the event and includes the number of users and percent of active users.

These ratings provide audience criteria for targeted messaging. For example, you could send users at high likelihood of churn a 20% off coupon. At the same time, you could send your most loyal users a discount referral code.
-
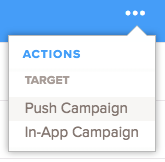
To follow up with push or in-app messaging for a group, select the ellipsis (...) at the end of the row.
-
Review the Related User Attributes table, which lists the user attributes most related to the conversion or churn event or action and includes the percent of active users observed to have each attribute and the relative difference (greater or lesser likelihood to convert or churn) from the average active user .

Use the top related user attributes to inform additional layers of segmentation, in addition to the high, medium, and low likelihood segments, to create even more targeted and relevant predictive audiences and messages.