Revenue
The Revenue dashboard displays revenue for the selected date range, based on nine different metrics:
|
Metrics |
Description |
|---|---|
|
Average Revenue per User |
Computed as revenue divided by unique users:
|
|
Average Revenue per Paying User |
Computed as revenue divided by paying users:
|
|
Cumulative Revenue per User |
Computed as total cumulative revenue divided by unique users:
|
|
Cumulative Revenue per Paying User |
Computed as total cumulative revenue divided by paying users:
|
|
Paid Users |
The count of unique users who performed an event with an associated value increase during the selected date range. |
|
Revenue |
The sum of all value increases observed over the selected date range. |
|
Revenue per Transaction |
Computed as revenue divided by transactions:
|
|
Transactions |
The count of events that occurred during the selected date range with a value attached. |
|
Transactions per Paying User |
Computed as transactions divided by paying users:
|
Using the Revenue dashboard
To work with the Revenue dashboard:
-
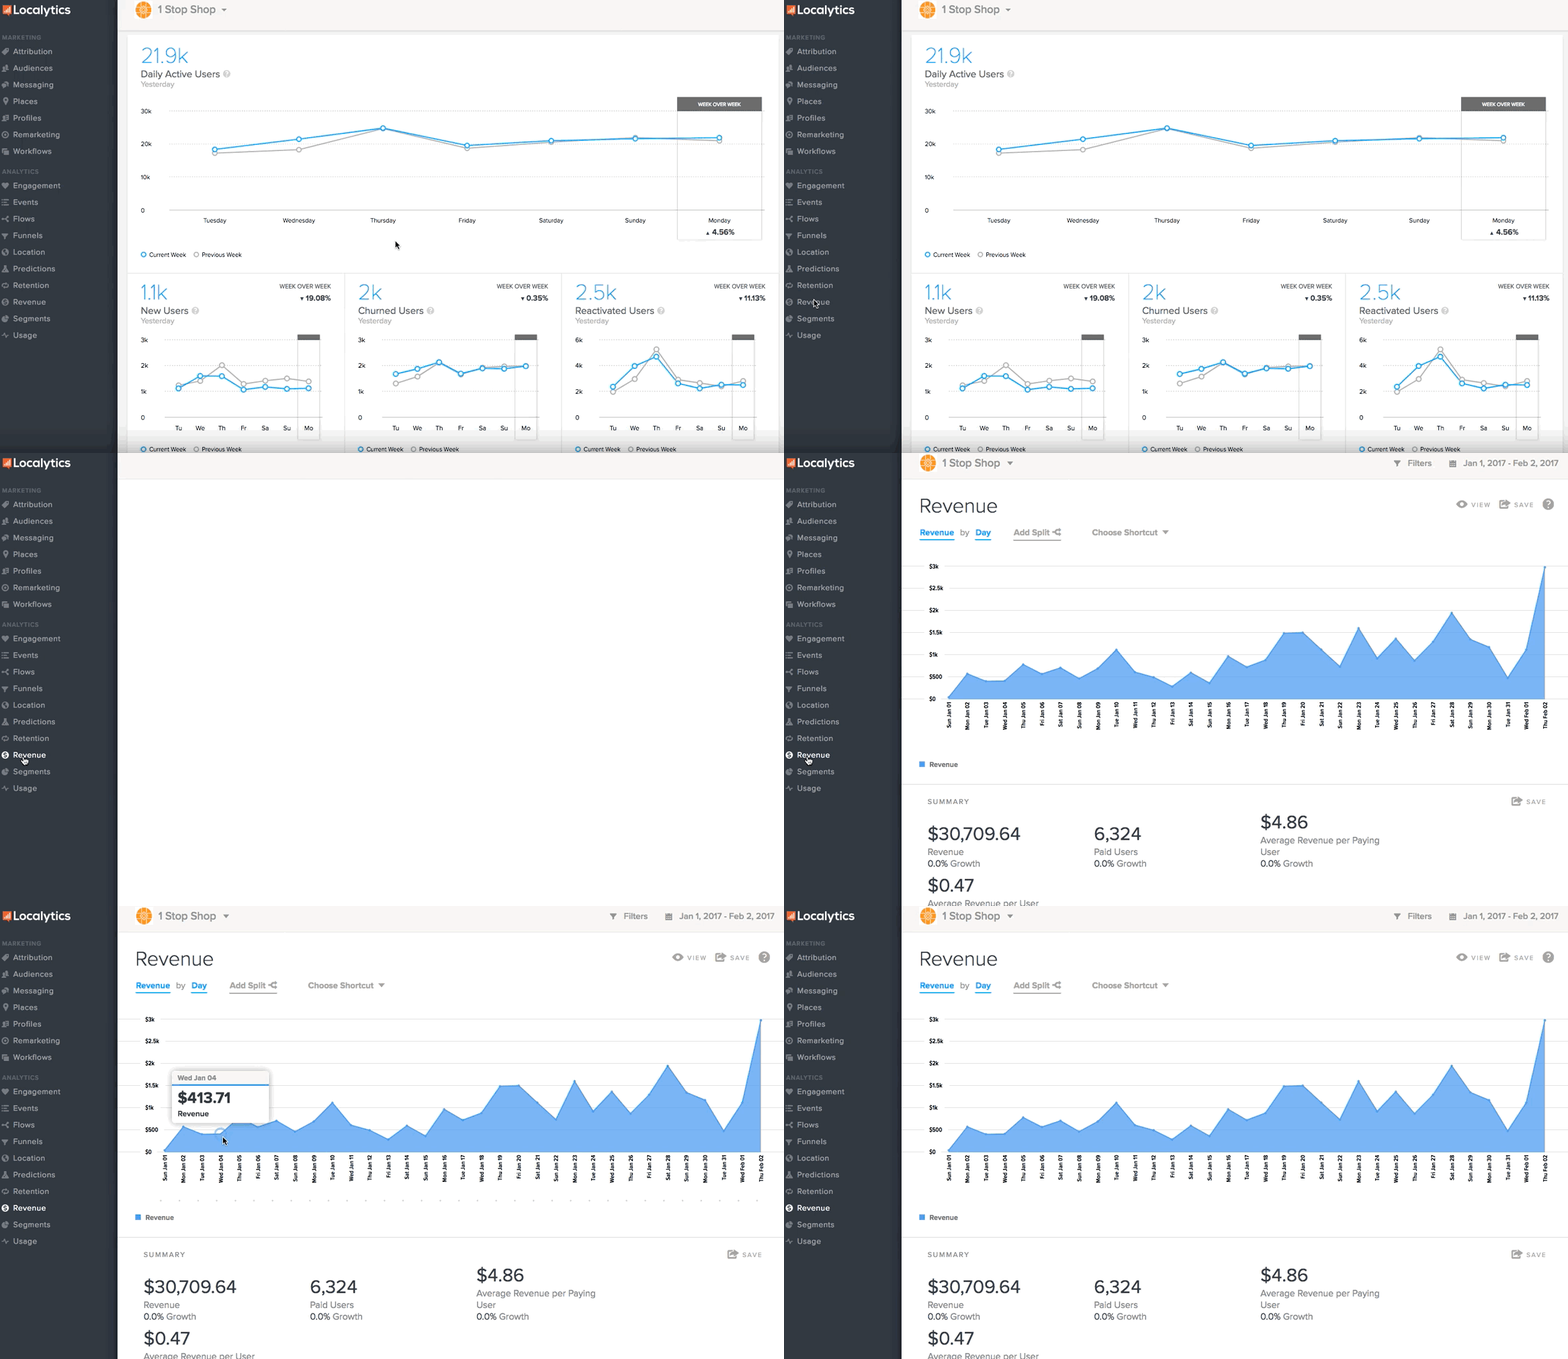
Go to Analytics in the left pane and select Revenue.

-
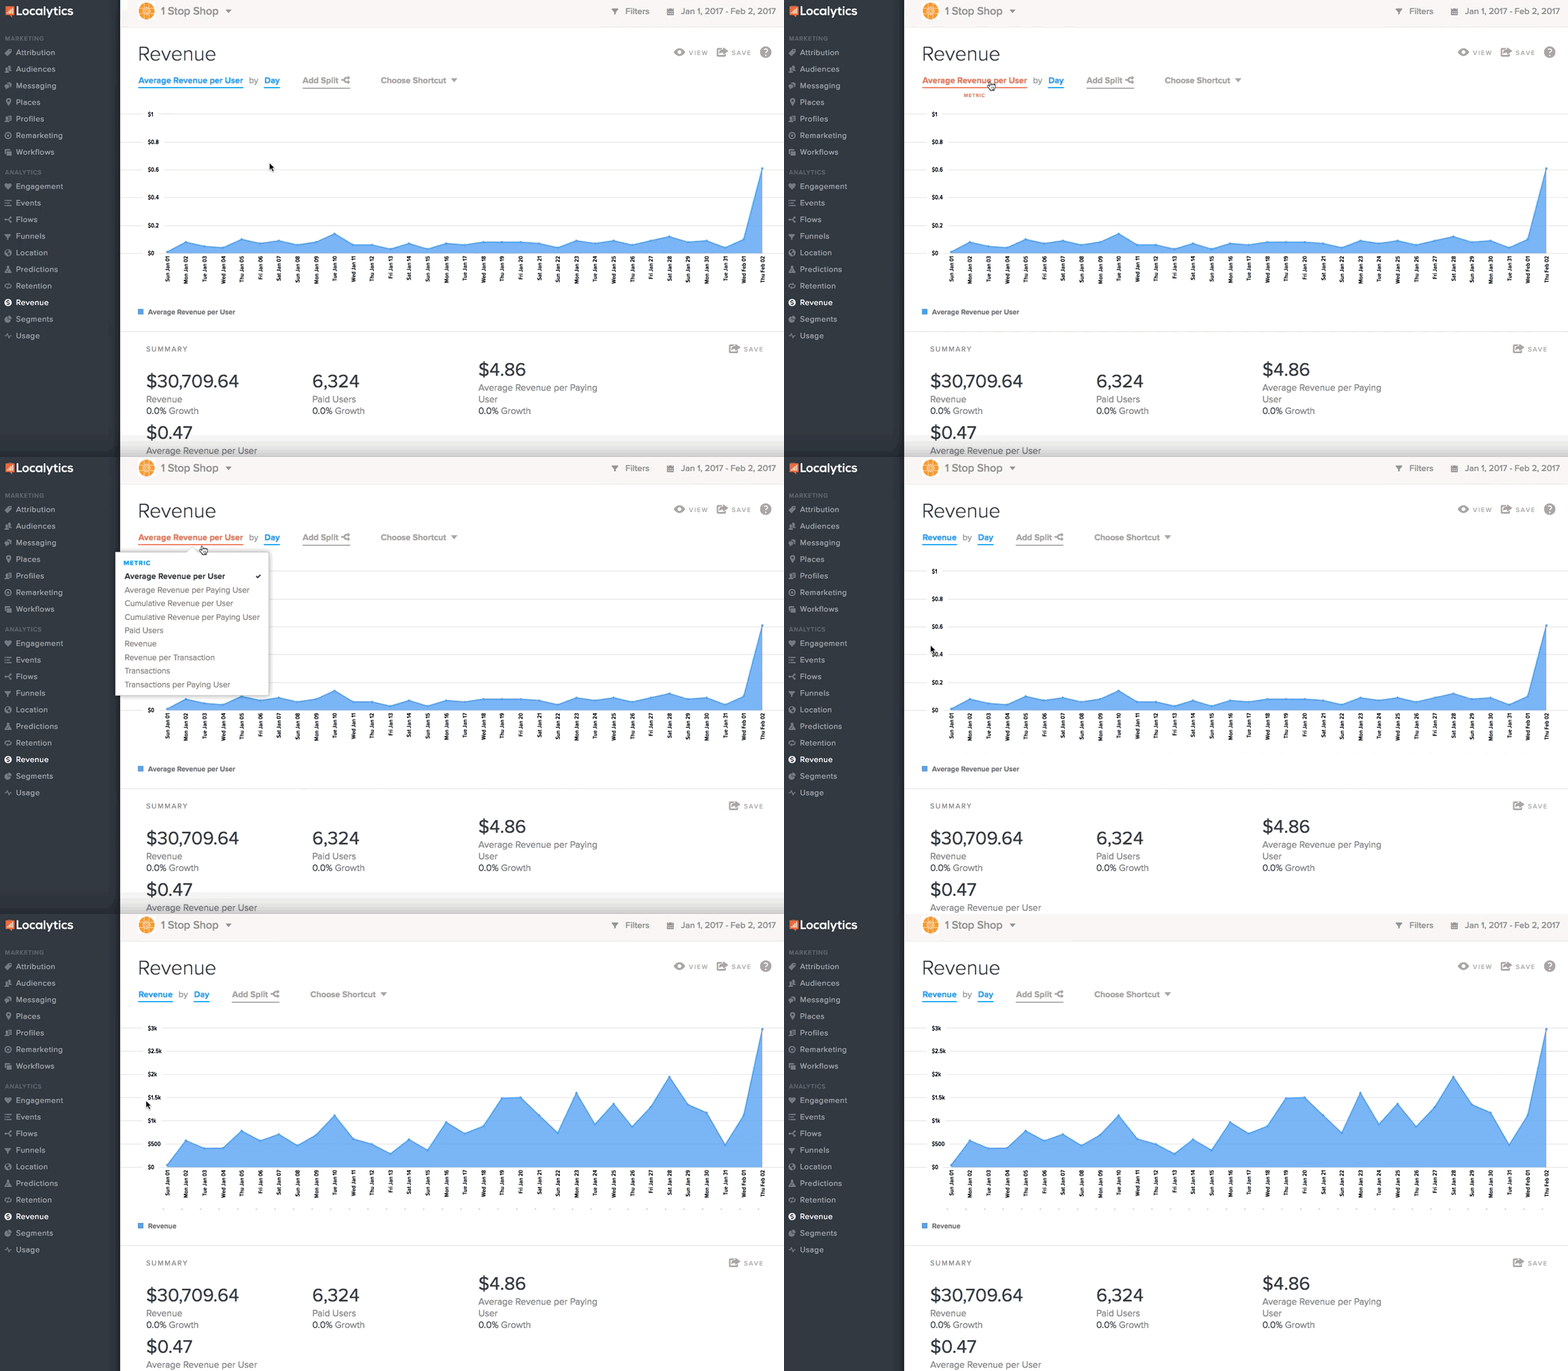
To change the metrics for viewing revenue data, select the highlighted metric in the upper-left corner and select the metric to use from the drop-down list.

Tip: The charts available in the Revenue dashboard measure revenue based on the Customer Lifetime Value of your users. You can choose to supply Customer Lifetime Value as a monetary (USD) value, which is most appropriate if the value maps to a purchase, or as a raw numeric value, which is most appropriate if your value maps to some other in-app metric like "movies watched" or "ads viewed."
-
Review the Summary section, which displays the following revenue data based on your selected date range: your total revenue, the number of paid users, the average revenue per paying user, and the average revenue per user for all users.
Note: % Growth compares revenue for the current date range to the same length of time immediately before. If you're looking at today, it compares to yesterday. If you're looking at the past 30 days, it compares to the previous 30 days.
Like most analytics reports, you can filter by dimension and/or profile, set a date range, change the view, save your report, apply data splits, and choose a shortcut. To learn more about these features, see Anatomy of an Analytics report.