Usage
Note: In Localytics, we define a user as a unique device. So if a single person has three devices, they’ll be logged as three different users. But if the device is used by multiple people, that will only be logged as one user.
Watch the video below for a quick overview of the Usage dashboard.
Using the Usage dashboard
To work with the Usage dashboard:
-
Go to Analytics in the left pane and select Usage.

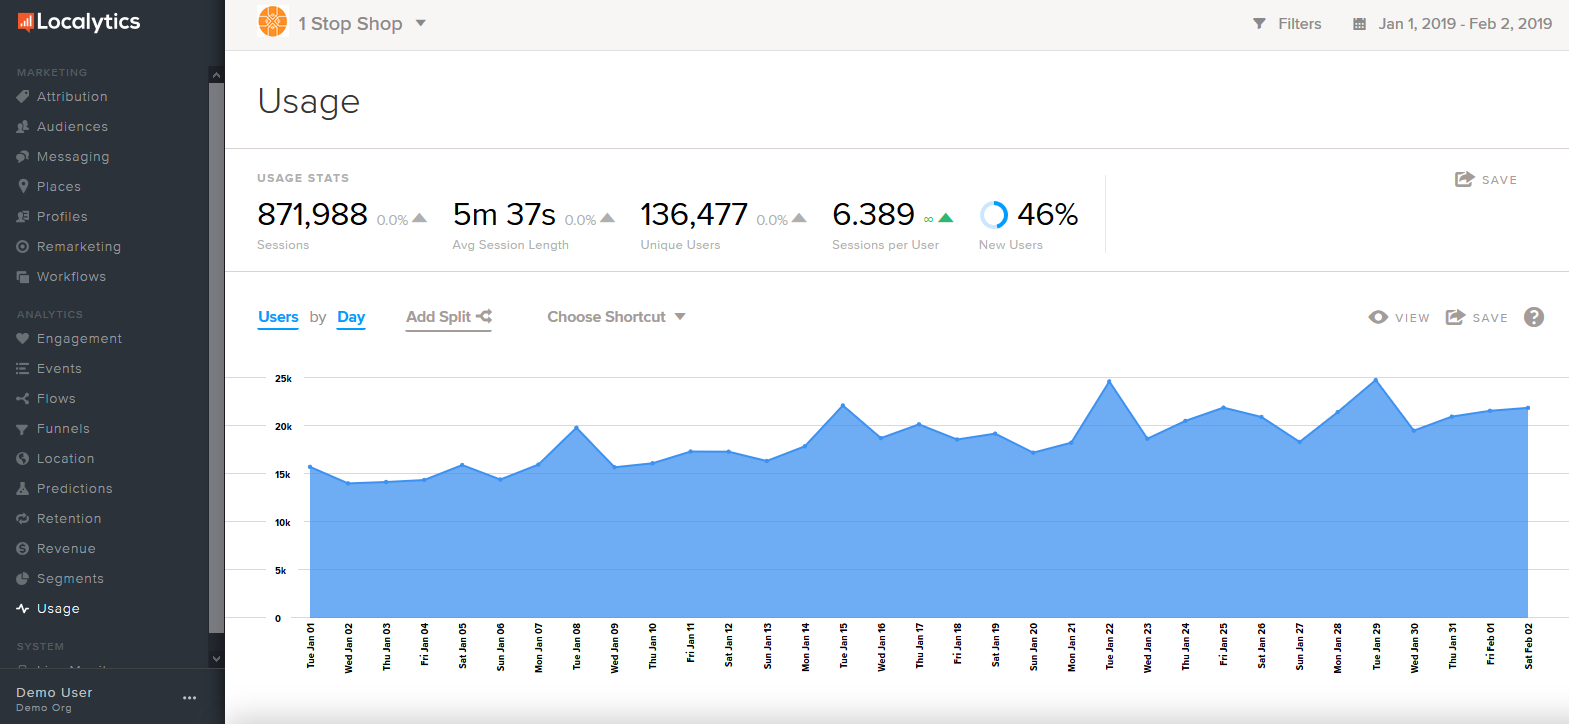
The Usage dashboard displays high-level metrics for users and sessions.
Metric Description
Sessions Number of times the app was opened
Avg Session Length Average time spent in app across all sessions
Unique Users How many users were unique
Sessions per User Number of times the app was opened per unique users
New Users Percent of total users who are first time users
-
For more information, point to a metric in the dashboard. A detailed description pops up.
-
Scroll down to the usage chart. To change the metrics, select the highlighted metric in the upper-left corner and select a metric from the drop-down list.
Metric Description
Users Number of users who had a session
Sessions Number of sessions
Sessions per User Number of sessions divided by the number of active users
-
To compare usage data across different metrics, select Add Split and then select a metric from the drop-down list. To clear the split, select the metric name and then select Clear.
For more information on the effect of splits on usage data, see Splits.
Like most analytics reports, you can filter by dimension, set a date range, change the view, save your report, apply data splits, and choose a shortcut. To learn more about these features, see Anatomy of an Analytics report.
How to use the Usage report
You can use the Usage report to improve your understanding of user activity, for example:
- Keep a pulse on your app's active user base and growth metrics. Save Save in the upper-right corner to add your current view to a custom dashboard, download a CSV or PDF file, or send daily, weekly, or monthly emails.
- Quickly gain insights on the makeup of your user base by splitting the report by New vs. Returning, by Push-Enabled, or by Acquisition Source.
- Set the report metric to Sessions per User and see if active users are having more or fewer sessions over time.
Splits
If you split your usage data, be aware that a single user can properly be counted in multiple subsets of the data.
Example: Andy opens your app for the first time on Tuesday, at this time he's a new user. Later that day he opens it again, now he's a returning user. On Tuesday (and only Tuesday), Andy will be counted once as a new user and once as a returning user when splitting by "New vs. Returning."
This is an example of a general analytics challenge called the "Hotel Problem." For more information, see What is the ‘Hotel Problem’ and how does it affect the interpretation of data? Just keep this in mind while you’re working with splits.