Debug without a debugger
Debugging in OL Connect Automate follows a different model than in OL Connect Workflow. Rather than relying on a traditional step-by-step debugger, Automate emphasizes flow visibility, editor-time feedback, and repeatable testing.
This difference is intentional and stems from how Automate flows are designed and visualized. The free-form canvas, horizontal layout, and scripting feedback in the editor make it easier to understand execution paths and detect errors without stepping through each action.
Canvas layout changes how you debug
The free-form canvas and horizontal layout make it possible to place large parts of a solution on a single screen. Nodes are typically arranged left to right, similar to lines of text, so the structure of the flow remains visible even as it grows.
The layout improves flow execution visibility. When a flow is running, it is easy to see where execution is happening and which node is active, because the surrounding context stays in view.
In Workflow, the experience was different. The vertical layout typically showed only a small portion of the process at a time. Once branching was added, related steps quickly moved out of view. Tracing execution across branches became harder, which is why step-by-step debugging was often needed to answer a basic question: where am I in the process right now?
Branching: seeing outcomes versus stepping through them
Consider this example of a text-based condition that can result in four different outcomes, each leading to a separate processing path.
Automate
In Automate, this is typically modeled as a single condition node with four outputs (for example, a switch or function node). Each branch is explicit and visible at the same decision point. Downstream logic can be placed directly after the condition or delegated to linked flows using Link nodes. This makes it immediately clear which path is taken when a message passes through the node.
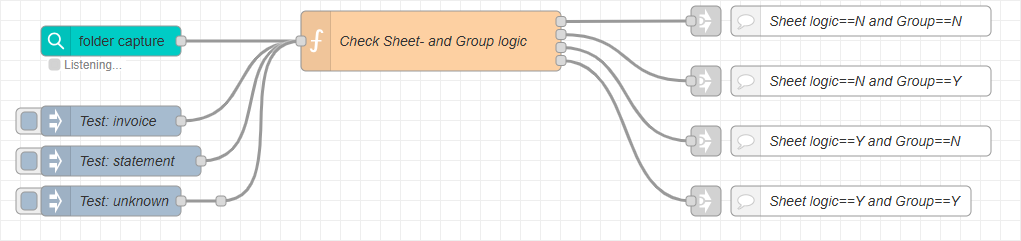
This setup is easy to test. In the example shown, three Inject nodes are used to represent different test scenarios (for example: invoice, statement, and unknown). Each scenario can be triggered with a single click, allowing the condition logic and resulting branches to be verified without loading or reselecting real sample data.
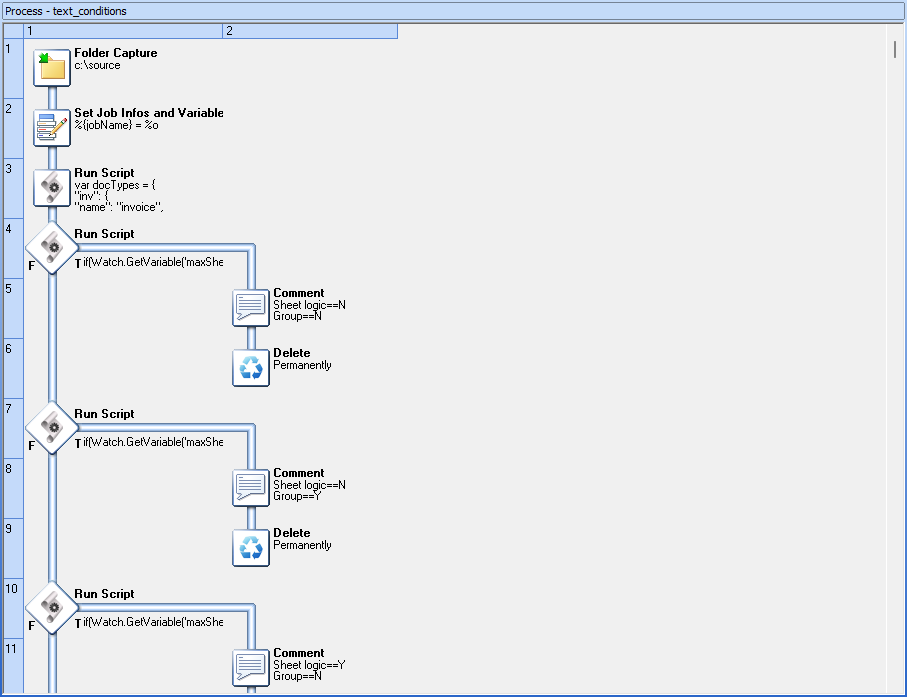
Workflow
In Workflow, the same logic often requires multiple condition steps. As additional tasks are added to each branch, relevant steps quickly move out of view. Understanding which branch was selected, and what happens next, often requires stepping through execution or extensive scrolling.
In other words, Automate emphasizes visual clarity of outcomes, while Workflow relies more heavily on procedural inspection during runtime.
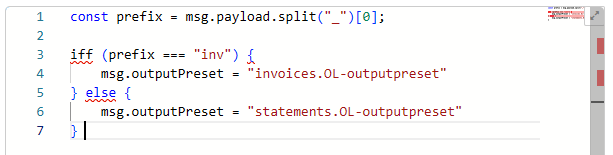
Scripting feedback reduces the need for stepping
Step-by-step debugging is required in Workflow when scripting is involved. The Run Script task (JScript) provides no feedback while you are writing code. Issues such as a missing semicolon, a typo, or an incorrect call to an internal API are only detected when the process is executed. As a result, step-by-step debugging is often used simply to locate where a script failed.
In Automate, script-based nodes such as the function node benefit from editor-time feedback. Common syntax and language errors are surfaced while editing, reducing the need to run to discover basic problems and allowing debugging to focus on flow logic and data rather than locating trivial script errors.
From stepping to testing
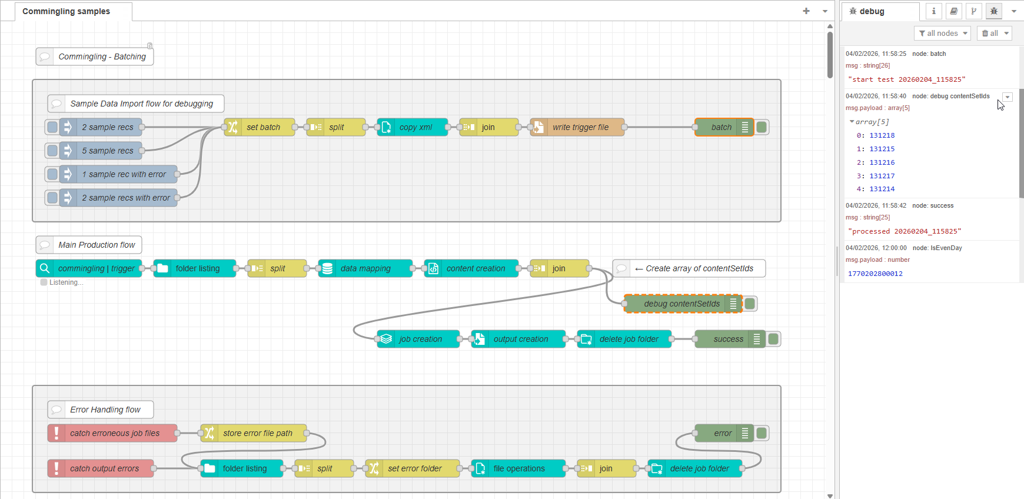
Debugging in OL Connect Automate is typically done using debug nodes placed at strategic points in the flow. This node provides a simple way to output message payloads or other data to the Debug sidebar. While this may initially feel like extra setup, it enables something that step-by-step debugging does not do well: repeatable testing and the ability to compare values across multiple steps.
With step-by-step debugging, values from earlier steps are often lost as execution moves forward. In OL Connect Automate, debug output is preserved in the Debug panel, making it easy to review and compare data from different points in the flow during a single run or across multiple test runs.
A common and effective pattern is to build a small test harness directly into the flow. For example, you might create several Inject nodes that feed the flow with different input scenarios:
-
a small data file (1 record)
-
a larger data file (100 records)
-
a data file with error scenario A
-
a data file with error scenario B
Each scenario can be triggered with a single click. Because this test setup lives in the flow itself, it is preserved across editing sessions and can be reused whenever the flow is modified.
In the sample flow below, the top group contains four test scenarios triggered by Inject nodes.
This approach applies to common integration patterns:
-
Folder capture flows can be tested by copying known test files into the watched folder.
-
REST-based flows (http in node) can be exercised using simple local calls (http request node).
In Workflow, testing these scenarios often requires manually selecting sample data per run or using external tools to trigger REST calls. That makes testing possible, but less immediate and less repeatable.
Tip: The test-harness pattern shown here is described in Automate sample data testing.
A shift in expectations
For users migrating from Workflow, the key shift is this:
Automate favors visibility and repeatable execution over step-by-step inspection.
Rather than walking through a process one step at a time, flows are designed so that execution paths are easy to see and test inputs are easy to replay. Over time, many users find this approach faster and more reliable, especially as flows evolve and need to be retested regularly.
Step-by-step debugging remains valuable in environments where execution is difficult to observe or replay. However, in OL Connect Automate, the canvas model, editor-time scripting feedback, and built-in testing patterns often remove much of that need.