The Data Viewer
The Data Viewer is located in the middle on the upper half of the DataMapper screen. It displays the data source that is currently loaded in the DataMapper, specifically one record in that data. Where one record ends and the next starts is determined in the Data Source settings (see Record boundaries). One record may contain more than one unit: PDF or Text pages, XML nodes, CSV lines, etc.
When the Delimiter or Boundary options are set in the Settings pane, the Data Viewer reflects those changes.
Any modification of the source data by a Preprocessor takes place before the data is displayed in the Data Viewer (see Preprocessor step).
The Data Viewer lets you select data, extract them (Extracting data), and apply a condition where necessary.
How data can be selected depends on the type of source file (see Selecting data).
Once data is extracted, clicking on any Extract step on the Steps pane highlights any area from which it extracts data in the Data Viewer. You can click on the Preprocessor step to select all the steps in the extraction workflow and highlight all extracted data.
Clicking on other step types also has a visible effect in the Data Viewer:Clicking on a Repeat step shows where the loop takes place.Clicking on a Goto step shows where the cursor is moved.Clicking on a Condition step shows which data fulfil the condition.For more information about the different steps that can be added to a data mapping workflow, see Steps.
Data Viewer toolbar
The Data Viewer has a toolbar at the top to control options in the viewer. Which toolbar features are available depends on the data source type.
-
Font (Text file only): Use the drop-down to change the font used to display text. Useful for double-byte data. It is recommended that monospace fonts be used.
-
 Hide/Show line numbers (Text file only): Click to show or hide the line numbers on the left of the Data Viewer.
 -
 Hide/Show datamap: Click to show or hide the icons to the left of the Data Viewer which displays how the steps affect the line.
 -
 Hide/Show extracted data: Click to show or hide the extraction selections indicating that data is extracted. This simplifies making data selections in the same areas and is useful to display the original data.
 -
 Lock/Unlock extracted data: Click to lock existing extraction selections so they cannot be moved or resized. This simplifies making data selections in the same area.
 -
Zoom Level: Use the arrows to adjust the zoom level, or type in the zoom percentage.
-
 Zoom In (CTRL +): Click to zoom in by increments of 10%
 -
 Zoom Out (CTRL -): Click to zoom out by increments of 10%
Additional Keyboard Shortcuts for XML and JSON files:
-
+ (while on an XML node or JSON element with children): Expand the XML node/JSON element.
-
- (while on an XML node or JSON element with children): Collapse the XML node/JSON element, hiding all its child nodes/elements.
Contextual Menu
You can access the contextual menu using a right-click anywhere inside the Viewer window.
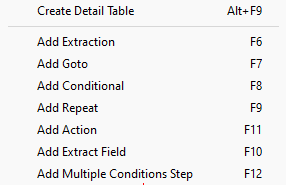
Note: Items shown or available depend on the type of file and other factors. The Add Extract Field item is available only after an Extract step has been added to the workflow. The Create Detail Table item is available only with JSON files, and only after an array has been selected in the JSON viewer.
Create Detail Tables for JSON data
This function allows you select an array and automatically transform its structure into a detail table within the OL Connect Data Model, and create the accompanying steps for the data mapping configuration. If the array contains nested arrays, these are converted into nested detail tables. This function significantly reduces the time and effort required to create a JSON data mapping configuration.
To create a detail table:
-
Select or insert a step in the Steps pane. The steps to create the detail table will be added below the selected step.
-
Select an array in the JSON viewer.
-
Right click, and select Create Detail Table.
-
The Steps pane updates with the steps to create the table, and the Data Model updates with the names and values for the data.
Create detail table limitations and considerations
-
An extraction step is created for each property in the object.
-
Field names are derived from property names.
-
Field types are automatically detected based on the property values.
-
When the editor has selected several nodes, only the last node is considered a valid candidate for the new action.
-
The array must have a name, (e.g. "myarray":[...]). An unnamed array (array within a array) cannot be selected to call the create detailed table action.
-
The array must have at least one object element with at least one key/value pair.
-
If the selected table contains objects and nested tables which are suitable for creating a deeper level of detailed table, a maximum of 3 levels of detailed table are created automatically. Level 4+ is treated as a JSON value, and no detail table is created for it.
-
The JsonPath iteration is calculated from the last known position in the editor. If the last known position is not available, the JsonPath is calculated from the root element.
-
If the selected array contains object values that are structured differently (e.g. the key set of key:value pairs in JSON object is different), only the first object is considered as the base object from which the list of extraction fields is created.
See Detail tables for more about detail tables.