Report Wizard Layout Tab
The Layout tab allows you to manipulate the appearance of your report by updating the column heading labels, format of numbers and dates, adding colors and changing column widths.
1. Click the Layout Tab
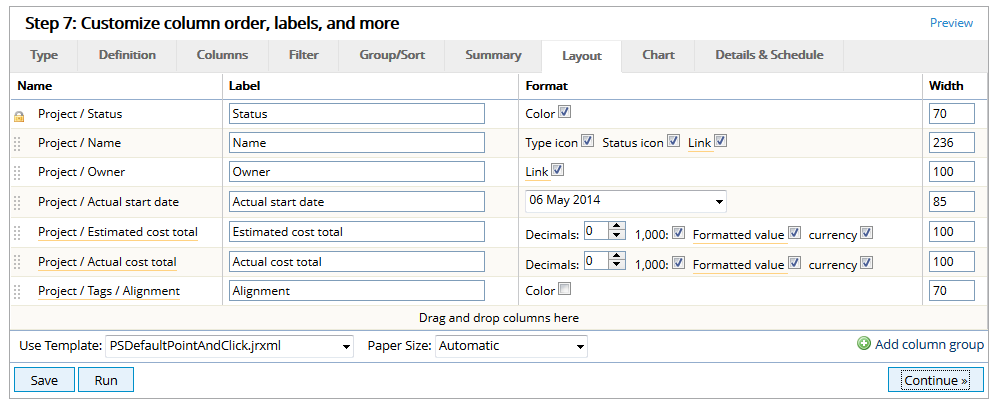
- Click the Layout tab.
The Layout tab has may options for you to improve the look of your report. Below is a description of the fields and options on the Layout page.
Name: This is a list of all the columns that are being displayed in your report. Using the dots to the left of the column name, you can drag and drop the column headings to rearrange the order of the report. The padlock symbol represents a column that is part of a grouping. These columns cannot be moved.
Label: This is where you can overwrite the name of the default column heading that has been provided by PowerSteering.
Format: There are multiple formatting choices available including the option to display colors, icons, hyperlinks and decimals. You can also indicate if you want a comma for thousands and a currency symbol.
Width: This is where you can overwrite the default width size (in pixels) that was provided by PowerSteering.
Use Template: Click this field to view the available templates for your report.
Paper Size: Click this field to view the available paper sizes for your report. Automatic re-sizes the page to fit your columns. Custom sizes can be entered in pixel amounts; 1 inch = 72 pixels.
Add column group: Click the green plus symbol to add a new column grouping to your report. A column group is a set of additional column headers that can bring several columns together under one heading.
2. Rearrange Column Order
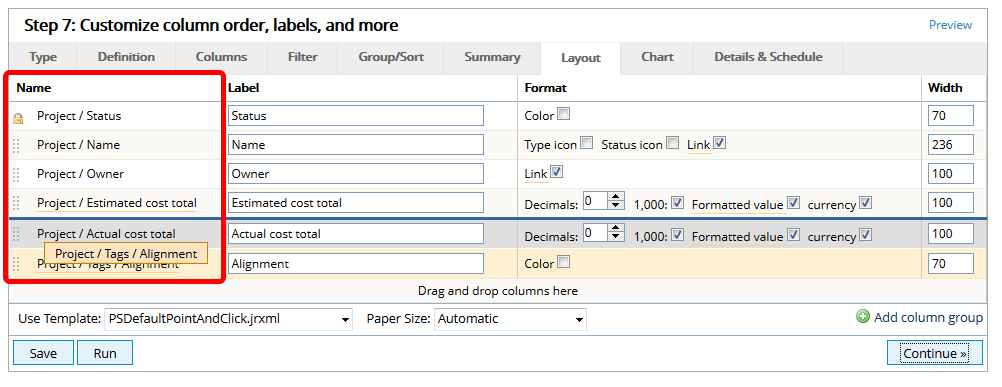
- Click the row of dots associated with the column you want to move. The page will change color to indicate the movement of the column.
- Drag the column to the new location and release.
3. Update Column Labels
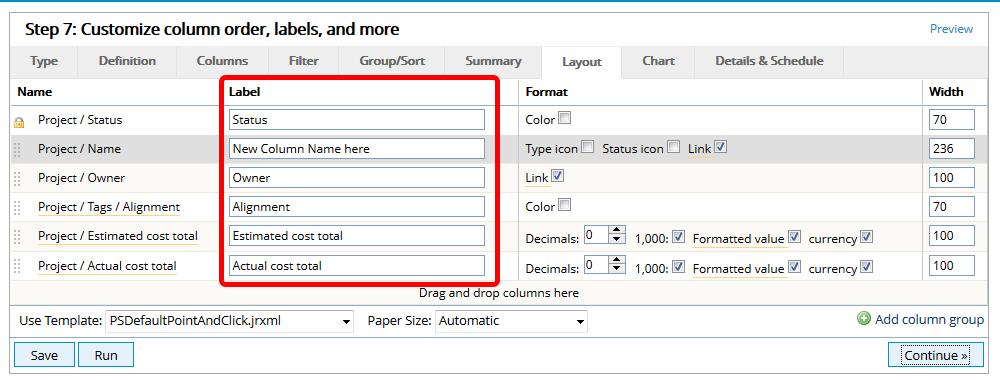
- Click in any field under Label, type a new name that will appear as the column heading.
4. Update Formatting
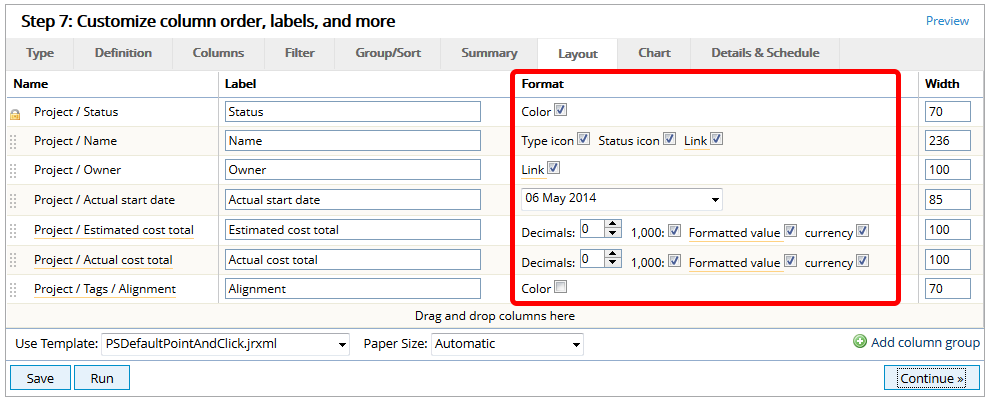
- Click to select the format options you want to update for your report.
Color: There are certain fields and tags that have color associated to their display. If you select the Color check box, the color will be displayed in the report.
Type icon: When selected, the object type associated with the name of the item on the report will be displayed.
Status icon: When selected, a status icon, in the color associated to the status of the object, will be displayed.
Link: When selected, a hyperlink to the item in the report will be visible.
Dates: Not all date formats in the Report Wizard are supported by Excel. Any date field should be formatted in the Layout tab to use something that is supported by Excel if that is how you plan to export the report. The default date format for the Report Wizard is DD MMM YYYY or 01 Jan 2013. You can do math on this format however Excel won't recognize the fields to sort or filter without updating the locale settings.
Decimals: Click this field to change the number of decimal places displayed on your report.
1,000: When selected, a comma will provide a separator for numbers that are one thousand and greater.
Formatted value: The formatted value should be used for summary and chart displays.
Currency: When selected, a currency symbol will be displayed.
5. Update Widths
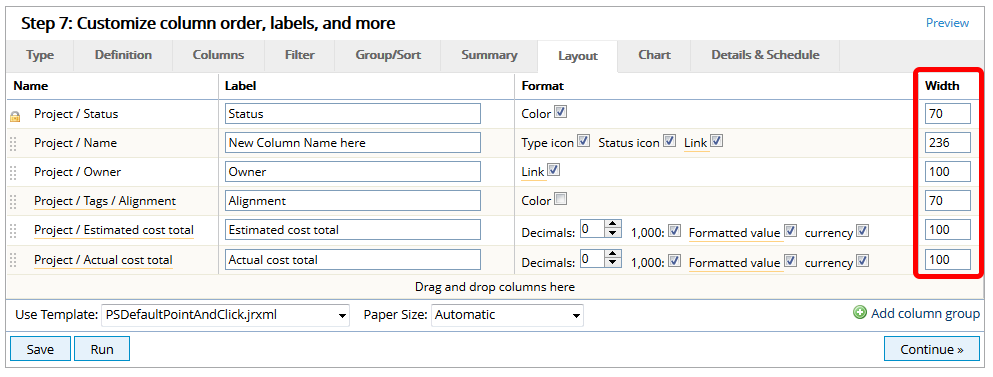
- Click in any field under Width, type a numerical value to apply a new width to that column. Width amounts are displayed in pixels.
6. Add a Column Group
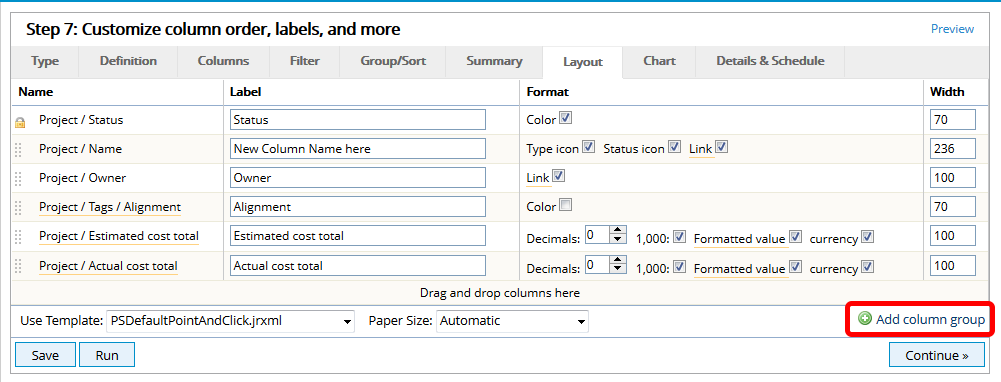
- Click the green plus symbol for Add column group.
6.1 Name Column Group
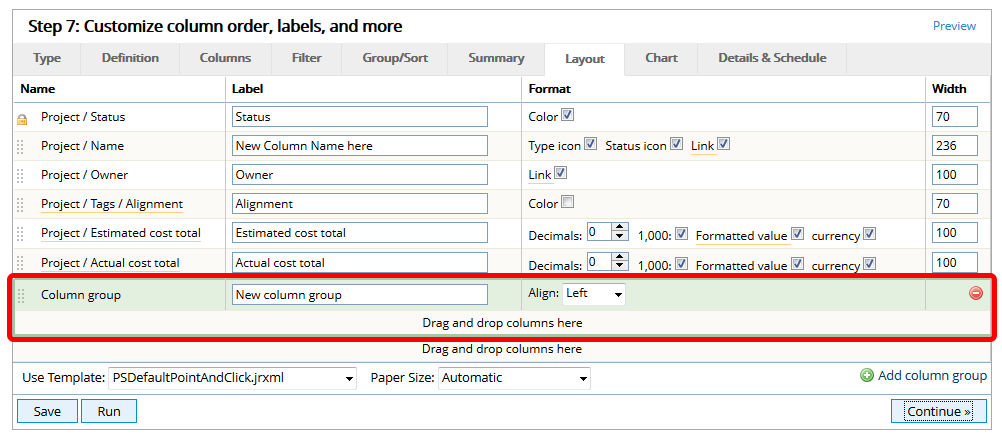
- Click New column group, type a new label for your column grouping.
6.2 Select Alignment
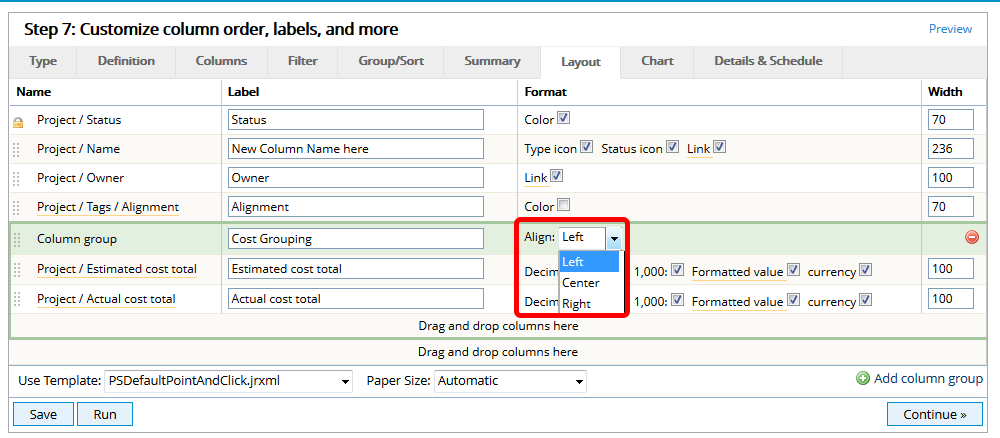
- Click Align, select Left, Center or Right for the location of your column group header.
6.3 Add Columns to Group
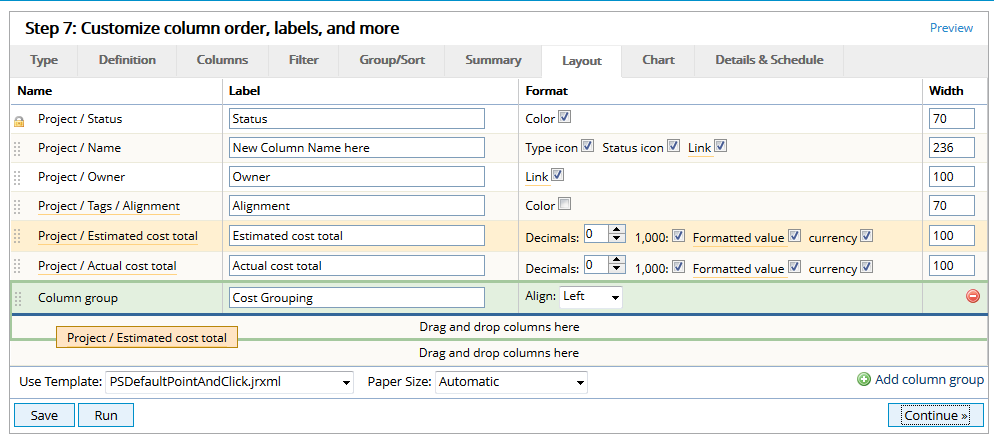
- Click the row of dots associated with the column you want to move into the column grouping. The page will change color to indicate the movement of the column.
- Drag the column to the Column group area and release.
6.4 View Column Grouping
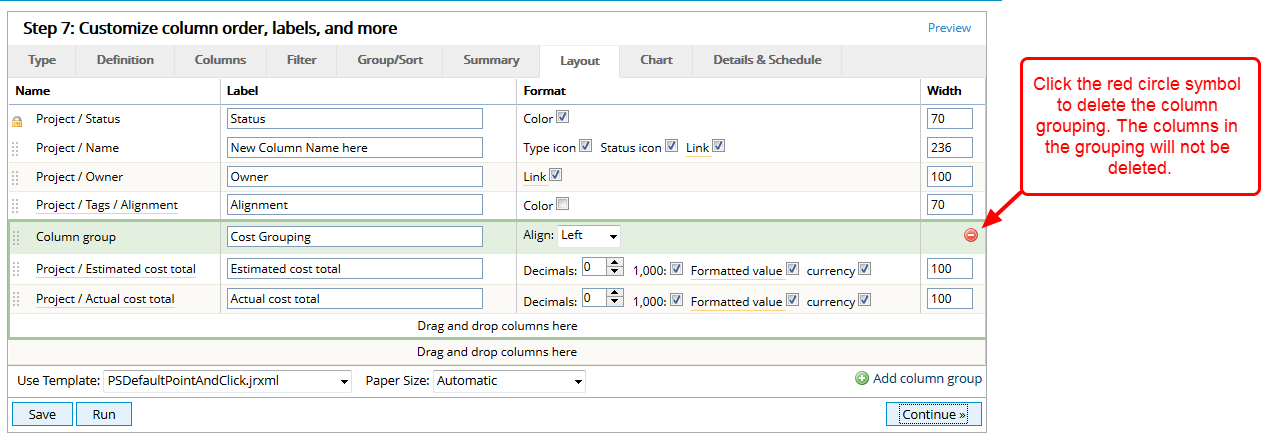
- View the newly created column group.
7. Click Preview (Optional)
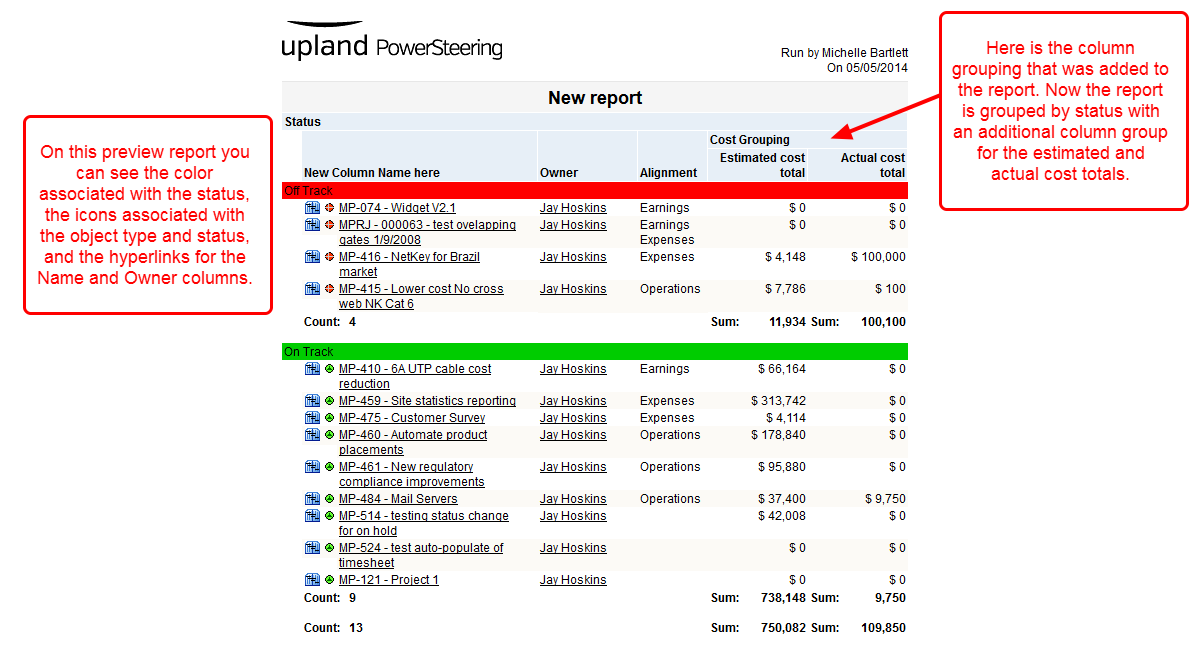
- Click the Preview link.
- View the report with the layout and format updates.
8. Click Continue or Tab
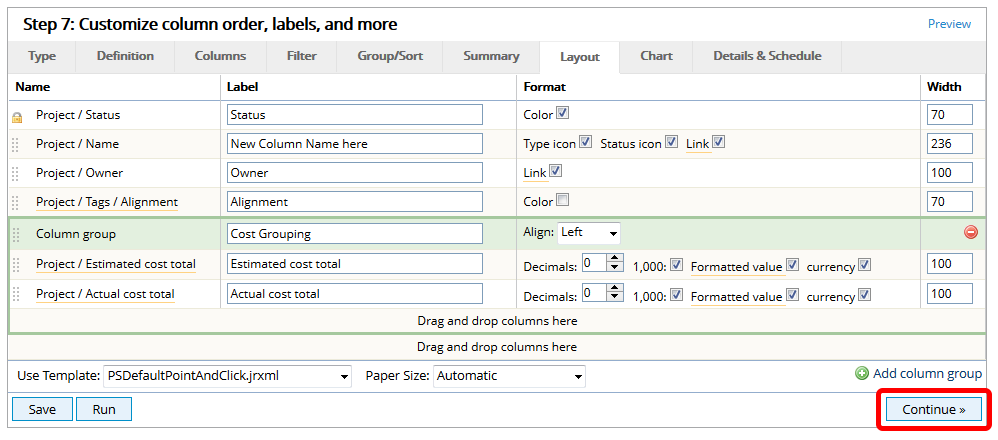
- Click Continue to go to the Chart tab, or click another tab within the Report Wizard.