Goal Indicators
A measure with a goal indicator evaluates your values by their progress towards a constant goal value and goal date. The data is compared against expected values and defined indicators to give visual cues about the measure’s performance. The indicators can be displayed in Dashboards and Executive Reviews and indicators and threshold messages will also be visible on the Summary page of any work item to which the measure is attached.
1. The Goal Indicator

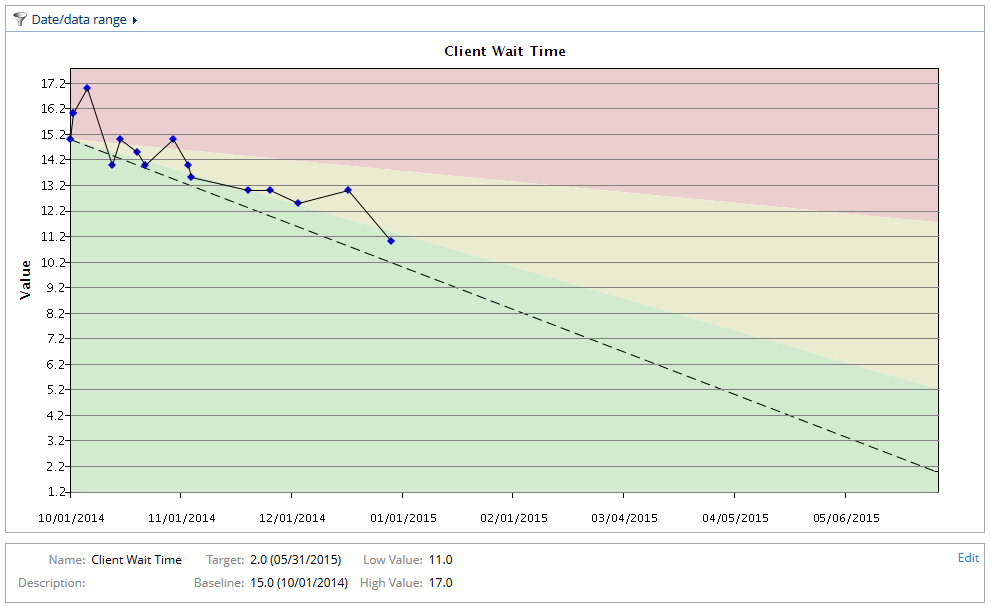
The screen shot above is an example of a measure chart with a goal indicator. When clients call your help desk, they currently wait an average of 15 minutes before they speak with a representative. This measure shows how client wait time is improving to the goal of 2 minutes with a target date of 05/31/2015.
1.1 Configure Goal Indicator Settings

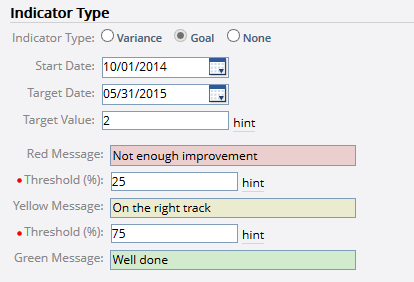
On the measure definition, the following settings are used to configure a goal indicator:
Start Date: The date on which you want to begin capturing data for the measure. The earliest value that you enter after the Start Date in the measure definition will serve as the measure’s baseline. Based on this information, PowerSteering automatically calculates what the expected values are for each period between the Start Date and the Target date and assumes a straight trend from the baseline to the target values.
Target Date: The date on which you want to have reached your Target Value.
Target Value: The goal value you want to achieve.
Red Message: The text that appears when the measure data is in the red zone.
Threshold: This value defines the red zone. If the measure is less than the defined percentage of the expected value for a period, it will be in the red zone.
Yellow Message: The text that appears when the measure data is in the yellow zone. If the measure is between the percentages defined for the red and green thresholds, it will be in the yellow zone.
Threshold: This value defines the green zone. If the measure is greater than the defined percentage of the expected value for a period, it will be in the green zone.
Green Message: The text that appears when the measure data is in the green zone.
The colored zones on the line graph are defined by the threshold values. They illustrate where your data is in relation to the expected value for a period.