Variance Indicators
Measure Templates with Variance Indicators evaluate Measure values based on their proximity to a specific Target Value. Values closer to the target, regardless of whether they are higher or lower, are considered better than those farther away. When values are added to these Measures, they will produce data visualizations that track how each value varies in comparison with the ideal rage (a.k.a. the green zone).
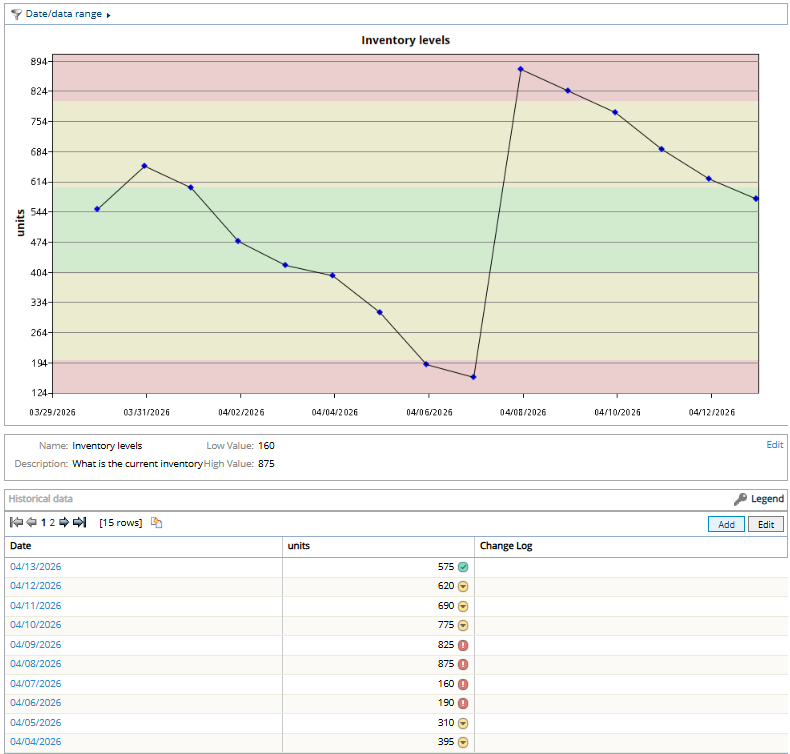
This data visualization graph tracks how far each value is from the ideal range of approximately 400-600 units.
The graph's background colors (green, yellow, and red) indicate how far each value is from the ideal range. Values can be either too high or too low, but the ideal area for them to land is the green zone. Values that land in the yellow zone should be considered a bit too high or low, and values that land in the red zone should be considered very high or low. The thresholds determine the range of each green, yellow, and red zone on the graph.
Tip: The data visualizations from Measures can be saved as PowerSteering Charts, which can then be attached to Dashboard Layouts.
Click here for an example of a Variance Indicator Measure in action
Example: Emma is in charge of her Project's total inventory of vacuums for sale. She does not want her inventory to drop too low because she might not be able to meet demand, but she also does not want inventory to be too high because it could result in excess holding costs (additional warehouse space, pallets, etc.). She decides that an inventory of 400-600 units is ideal to avoid both of these risks.
To track her inventory, she creates an "Inventory levels" Measure Template. She set up thresholds based on the ideal range of 400-600 units. Also, she sets a "Very high inventory" threshold to warn her when inventory is dangerously high and a "Very low inventory" threshold to warn her when inventory is dangerously low.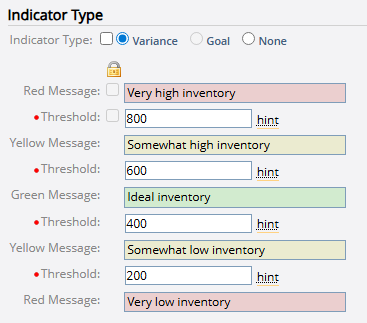
She attaches the Measure to her Project and inputs the current inventory as a value each day. The graph indicates when inventory is too high or too low, which lets her know when to order more stock and when to hold off on more orders.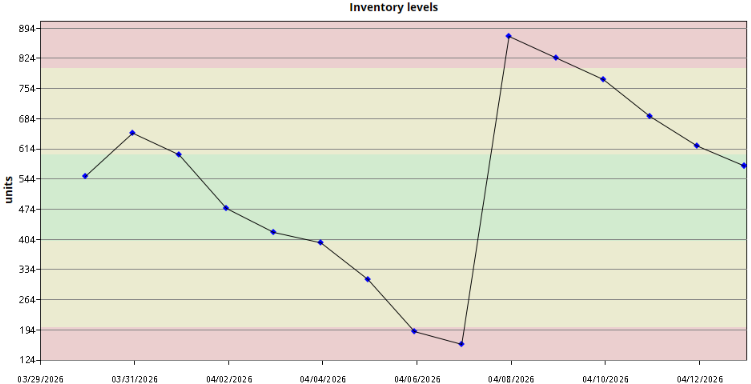
Variance indicator settings for Measure Templates
Note: If you are attempting configure Variance Indicator settings for a new Measure, you must first follow Steps 1-7 from Add a New Measure Template. Whether you are creating a new Measure Template or editing an existing one, you must have the "Measure Template" Context permission.
-
Locks: Notice the Lock icon
 with checkboxes directly below it. When the checkbox next to a field is selected, that field is considered locked. Any changes made to locked fields will be applied to all Measure instances that have been attached to PowerSteering work items. Changes made to unlocked fields will not be applied to existing Measures; they will only be applied to new Measure instances that are attached to work items going forward.
Note: The checkbox next to the "Red Message" field controls all five messages. Similarly, the checkbox next to the first "Threshold (%)" field controls all thresholds.
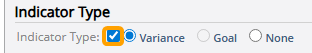
Note: In order to use locks, select the checkbox directly under "Indicator Type".
Tip: Selecting a Lock icon
will automatically select/deselect all of the checkboxes directly below it. -
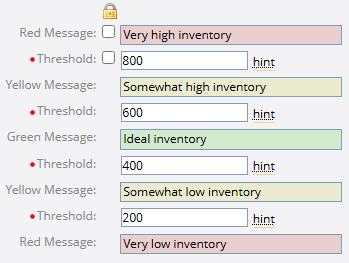
Messages (Red, Yellow, and Green): Enter the text that will appear when a user scrolls their cursor over one of the values in the corresponding section.
Example: Emma enters "Very high inventory" in the top "Red Message" field.
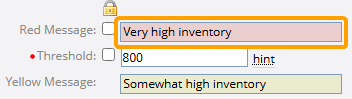
Users will see the message when they scroll over a Measure value in the graph's top red zone.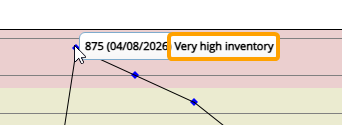
-
Thresholds: Enter the thresholds that will determine the borders of each zone.
Example: Emma enters "800" as the threshold above the top "Yellow Message" field and "600" as the threshold below it.
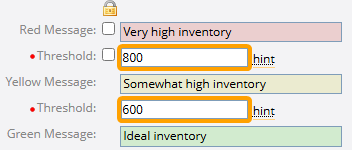
This means that the range of the top yellow zone is between 600 and 800 on the graph.