Executive Review Overview
The Executive Review, often referred to as the "bubble charts" are multidimensional charts that can really wow an audience. They are generally configured by Administrators that have the permission to create Executive Review layouts. The Executive Review can be viewed as part of your Home Page configuration or on its own through the Review menu.
1. The Executive Review

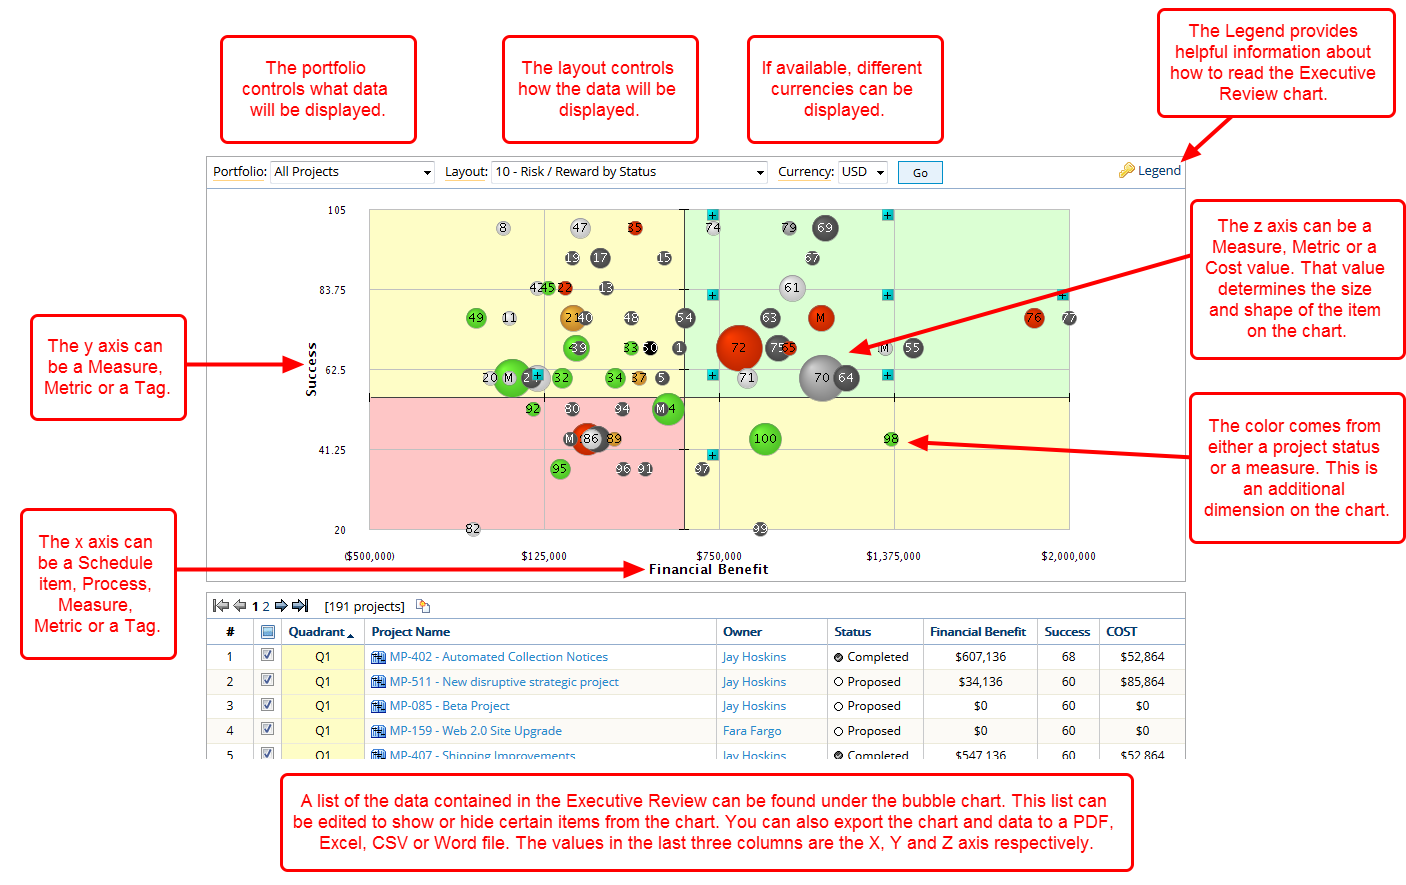
The Executive Review, also referred to as a bubble chart, allows you to create a multidimensional display using an x, y and z axis. You can also add project status or a measure as an additional dimension. Users can define the portfolio that they want to use with an Executive Review but not the layout which determines how the data is displayed. Only someone with the Executive Review Layout Administration permission can create or edit an Executive Review layout. Below is a description of each component of the Executive Review.
Portfolio: This is a collection of work objects, generally projects, that can be applied to an Executive Review, Financial Review or dashboard in association with a layout. Portfolios control what information is displayed.
Layout: This is a set of definitions that control how the information is displayed on the page. The layout options differ between the Executive Review, Financial Review and dashboard.
Currency: If you have multiple currencies configured in PowerSteering, you can change the currency that is displayed in the Executive Review.
Legend: The legend provides definitions for the shapes, sizes and colors displayed on the Executive Review.
x Axis: The x, or horizontal axis, can be defined using a schedule item, process, measure, metric or tag.
y Axis: The y, or vertical axis, can be defined using a measure, metric or tag.
z Axis: The z axis, which is represented in shape or size, can be defined using a measure, metric or cost value.
Additional Axis: The additional axis, which is represented by a color, can be defined using a project status or a measure.
Data List: Below the Executive Review chart is a list of all the data that is being displayed on the chart. You have the option of looking at all projects, or using the check boxes to remove certain projects from view.
Note: If there are more than one projects with the same x-axis value, they will be grouped into a single bubble that will contain the letter "M" indicating multiple. Click on any bubble to view its contents.
2. View Hover Information
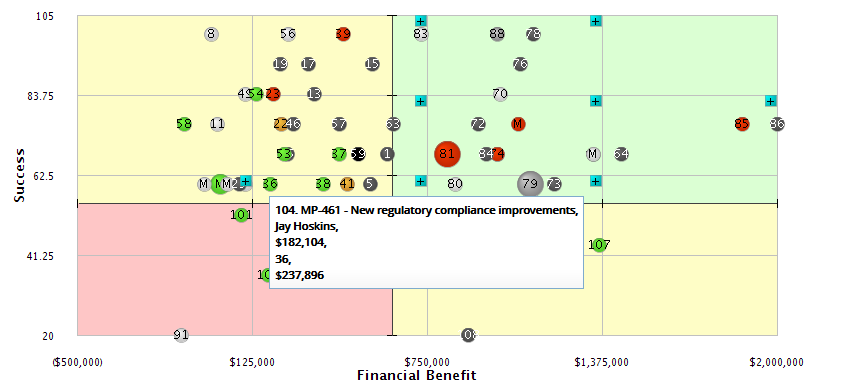
Within the Executive Review you can hover over items within the chart or the data list to view additional information. The next few steps detail that additional information.
2.1 Hover on Chart

- Using your mouse, hover over any of the items in the Executive Review chart. Be careful not to click on the item, as that will close the Executive Summary and open up the Summary page for the selected item.
2.2 Hover on x Axis

- Using your mouse, hover over the x-axis column heading to view the layout definition for this value. The values in the last three columns are the x, y, and z axis, respectively.
2.3 Hover on y Axis

- Using your mouse, hover over the y-axis column heading to view the layout definition for this value. The values in the last three columns are the x, y, and z axis, respectively.
2.4 Hover on z axis

- Using your mouse, hover over the z-axis column heading to view the layout definition for this value. The values in the last three columns are the x, y, and z axis, respectively.
3. Sort Columns

- The data list can be sorted by any of the column headings. Click on the column heading once to sort by ascending order, click again to sort by descending order. The small triangle symbol to the right of the column heading name indicates if the column is sorted in ascending or descending order.
Note: The Status column does not sort by ascending or descending order, but rather in the order of a project life cycle; therefore, Proposed is the first value for ascending order and Canceled is the first value for descending order.