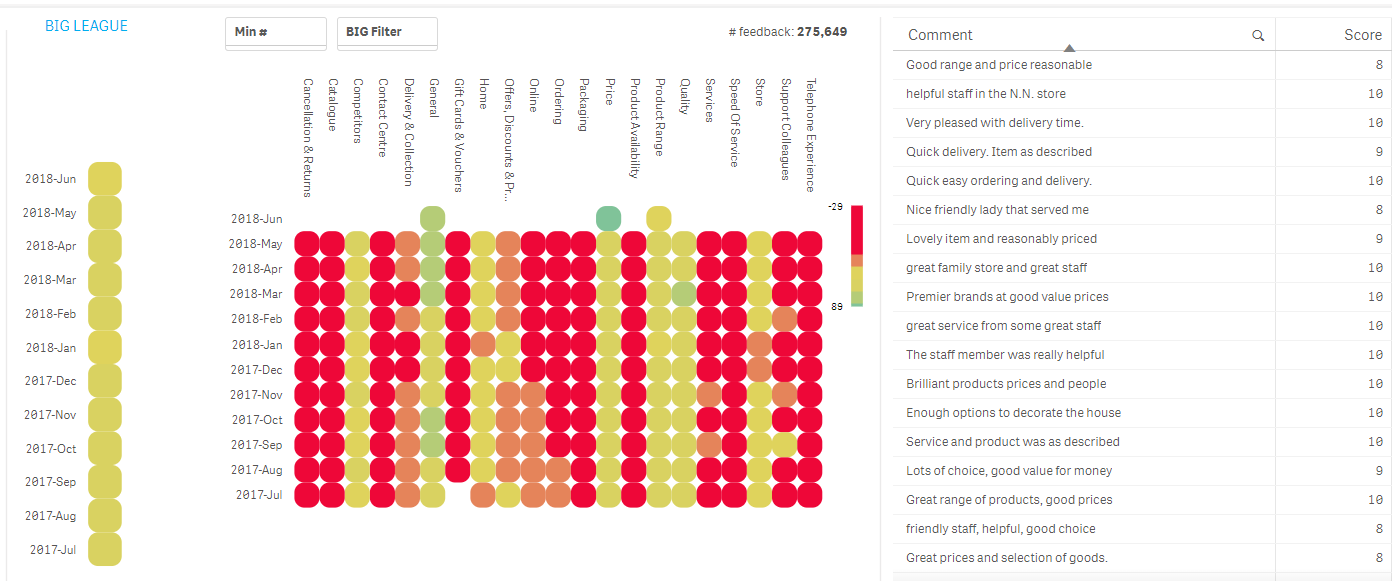
The BIG sheet is where you examine how various parts of your business contribute to positive or negative feedback, so you can turn insight into action.
To make selections and update the report:
-
Click a data point in a chart or graph in the content area of a sheet.
All associated visualisations are updated immediately. A confirmation box displays around the selection.
-
To confirm the selection, click the Tick (
 ) icon or press ENTER.

The following table describes the sections of the BIG sheet
| Section | Description and actions |
|---|---|
|
BIG LEAGUE |
Shows the categories (from the bottom-most level of your taxonomy) that have generated the most insights and correlate these categories with your metadata. For example, the it may show which of your locations or touchpoints are doing best and worst for each category. the worst performing part of your business displays at the top of the table. Each intersection in the table is coloured based on the average given score for that row/column combination. If there are no results for a row/column combination, the row/column intersection is shown as blank.
|
|
SAMPLE COMMENTS |
Displays a selection of comments based on the filters you have selected to ensure the in-context voice-of-the-customer is always with you. |