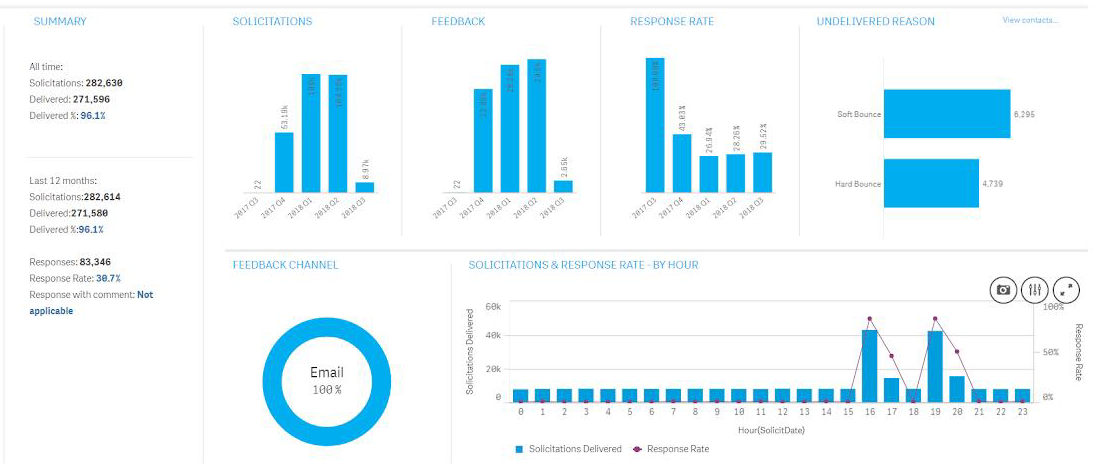
The Response Rates sheet helps you understand the health of your feedback requests: how many feedback requests you are sending to customers, which channels you are sending the requests over, and the number of feedback responses you receive.
To make selections and update the report:
-
Click a data point in a chart or graph in the content area of a sheet.
All associated visualisations are updated immediately. A confirmation box displays around the selection.
-
To confirm the selection, click the Tick (
 ) icon or press ENTER.

The following table describes the sections of the Response Rates sheet:
| Section | Description and actions |
|---|---|
|
SUMMARY |
Provides the following at-a-glance statistics:
|
| SOLICITATIONS |
Shows the volume of feedback requests sent to customers over the past five quarters so you can compare them over the year and to the same quarter in the previous year.
|
| FEEDBACK |
Shows the volume of feedback received sent over the past five quarters so you can compare them over the year and to the same quarter in the previous year.
Note: An item of feedback is recorded against the date the feedback was requested by. |
|
RESPONSE RATE |
Shows the feedback response rate for the past five quarters so you can compare them over the year and to the same quarter in the previous year.
|
|
UNDELIVERED |
Displays the top reasons solicitation were undelivered.
|
|
FEEDBACK CHANNEL |
Shows the percentage split of feedback requests by channel type.
|
|
SOLICITATIONS & RESPONSE RATE - BY HOUR |
Identifies the best times to send feedback requests to maximise your response rate. The vertical bars are a count of feedback requests delivered per hour and the line graph shows the response rate per hour. |