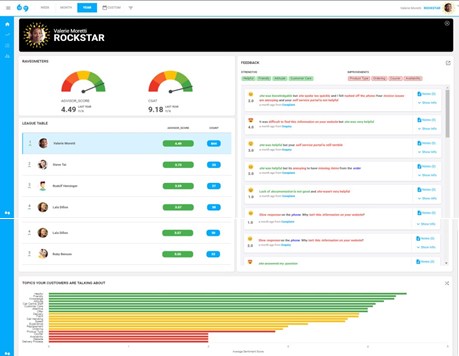
The Frontline Engagement dashboard is where you can see customer feedback for an individual user, a member of your team, or your team as a whole. The dashboard gadgets provide clear visibility into what is going well and where improvement is needed.

For team leaders and managers, the Frontline Engagement dashboard displays sections with the tools you need to evaluate one or more team's performance based on customer feedback. The Time settings at the top of the page determine the period of time when the feedback was collected.
- To change the period of time for the data in the graph, click Week, Month, Year, or Custom at the top of the dashboard. If you select Custom, use the calendar to select a start date and an end date, and then click Apply.
- To filter the sections displayed in the dashboard, click the Filter (
 ) icon at the top of the dashboard and then select the values for scores, structured fields, and categories to view. When you are done, click the Close (
 ) icon in upper-right corner. To clear your selections, click Clear Filters in the lower-right corner.
The following table describes each section:
| Section | Description and actions |
|---|---|
| User identifier | The current user's photo or initial and user name are displayed in the upper-right corner of the page. Note: If you are a supervisor and you have logged in as another manager, the user identifier specifies that you are impersonating the other manager. |
| Raveometer | The Ravometers display your team's overall feedback score for several score measures:
|
| League table | The League table displays the top performers of your team or teams, with their scores.
|
| Feedback | The Feedback pane displays the displays the taxonomy categories for the most common positive (in green) and negative (in red) comments about your team from your customers:
|
| Topics your customers are talking about | The Topics pane at the bottom of the dashboard charts the average Sentiment score for the most common positive (in green) and negative (in red) comments in your customers' feedback for your team. |
From the Frontline Engagement dashboard, you can access the following dashboards:
Trends
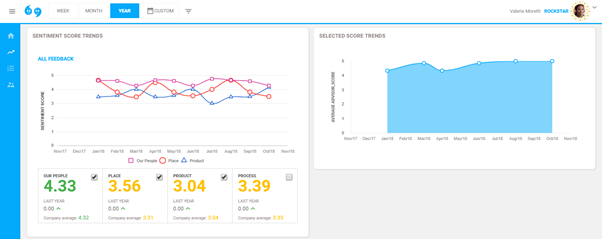
For an overview of sentiment score trends over a period of time:
-
Click
 Trends in the left pane menu.
You see a graph tracking sentiment scores for people, place, process, and product over the selected period of time. Additional information for each category appears below the graph.
-
To view scores for one or more categories separately, select the check box for one or more categories in the table. The graph for all feedback updates to reflect the selected categories.
-
To track other score measures, click your user name in the upper-right corner of the page, and then select a score measure from the drop-down list. Click your user name again to close the pop-up box.
The graphic in the right pane updates to reflect your selection.
- To return to the Frontline Engagement dashboard, click
 Home in the left pane menu.
Rankings
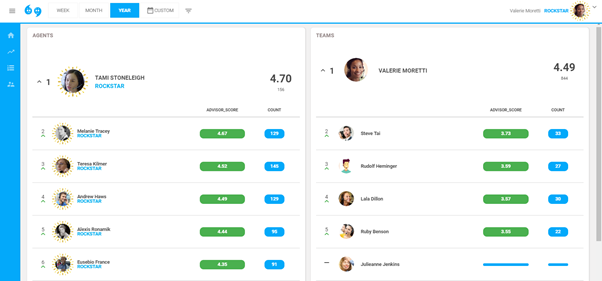
For additional information on individual rankings within teams:
-
Click
 Rankings in the left pane menu.
On the left, you see a list of individual agents and their score measure for the selected time period. The top-scoring agent for the score measure appears in position 1, at the top of the list. On the right, you see a list of teams.
-
To change the score measure, click your user name in the upper-right corner of the page and then select a score measure from the drop-down list.
The Agents list adjusts the rankings for the new score measure.
- To return to the Frontline Engagement dashboard, click
 Home in the left pane menu.
Supervisor
If you are a manager, you also have access to the Supervisor dashboard.
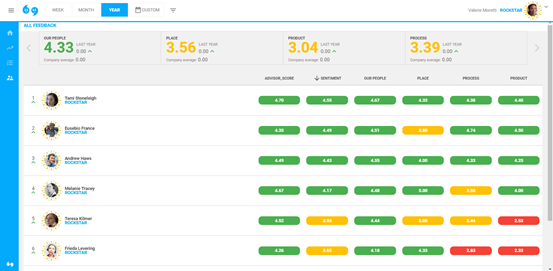
To view score measures for individual team members whom you supervise:
-
Click
 Supervisor in the left pane menu.
You see a table of all feedback scores during the selected time period for the individuals you supervise. The title, All Feedback, appears in the upper-left corner of the page. Additional information for each score category appears at the top of the page.
- Click > Right and < Left to navigate the categories at the top of the page.
-
To narrow the data in the table, click a category. The title at the top of the page updates to include the category. To clear your selections, click All Feedback in the upper-left corner of the page.
-
To change the score measure, click your user name in the upper-right corner of the page and then select a score measure from the drop-down list. The new score measure moves to the left side of the table.
- To sort the table by a score measure, click the title in the header row.
- For more information about a score for an individual, locate the name in the table and then click the field that corresponds to the score measure in the row. A graph of the user's performance over the se;ected time period pops up. To close it, click elsewhere in the table.
- To return to the Frontline Engagement dashboard, click
 Home in the left pane menu.
 ) icon in the upper-right corner. To close the message panel, click the Close (