Portal Reports
The standard portal reports are available in the Administrator Console.
-
Open the Administrator Console.
-
Navigate to Reports > Portal. The Standard Reports page is displayed.
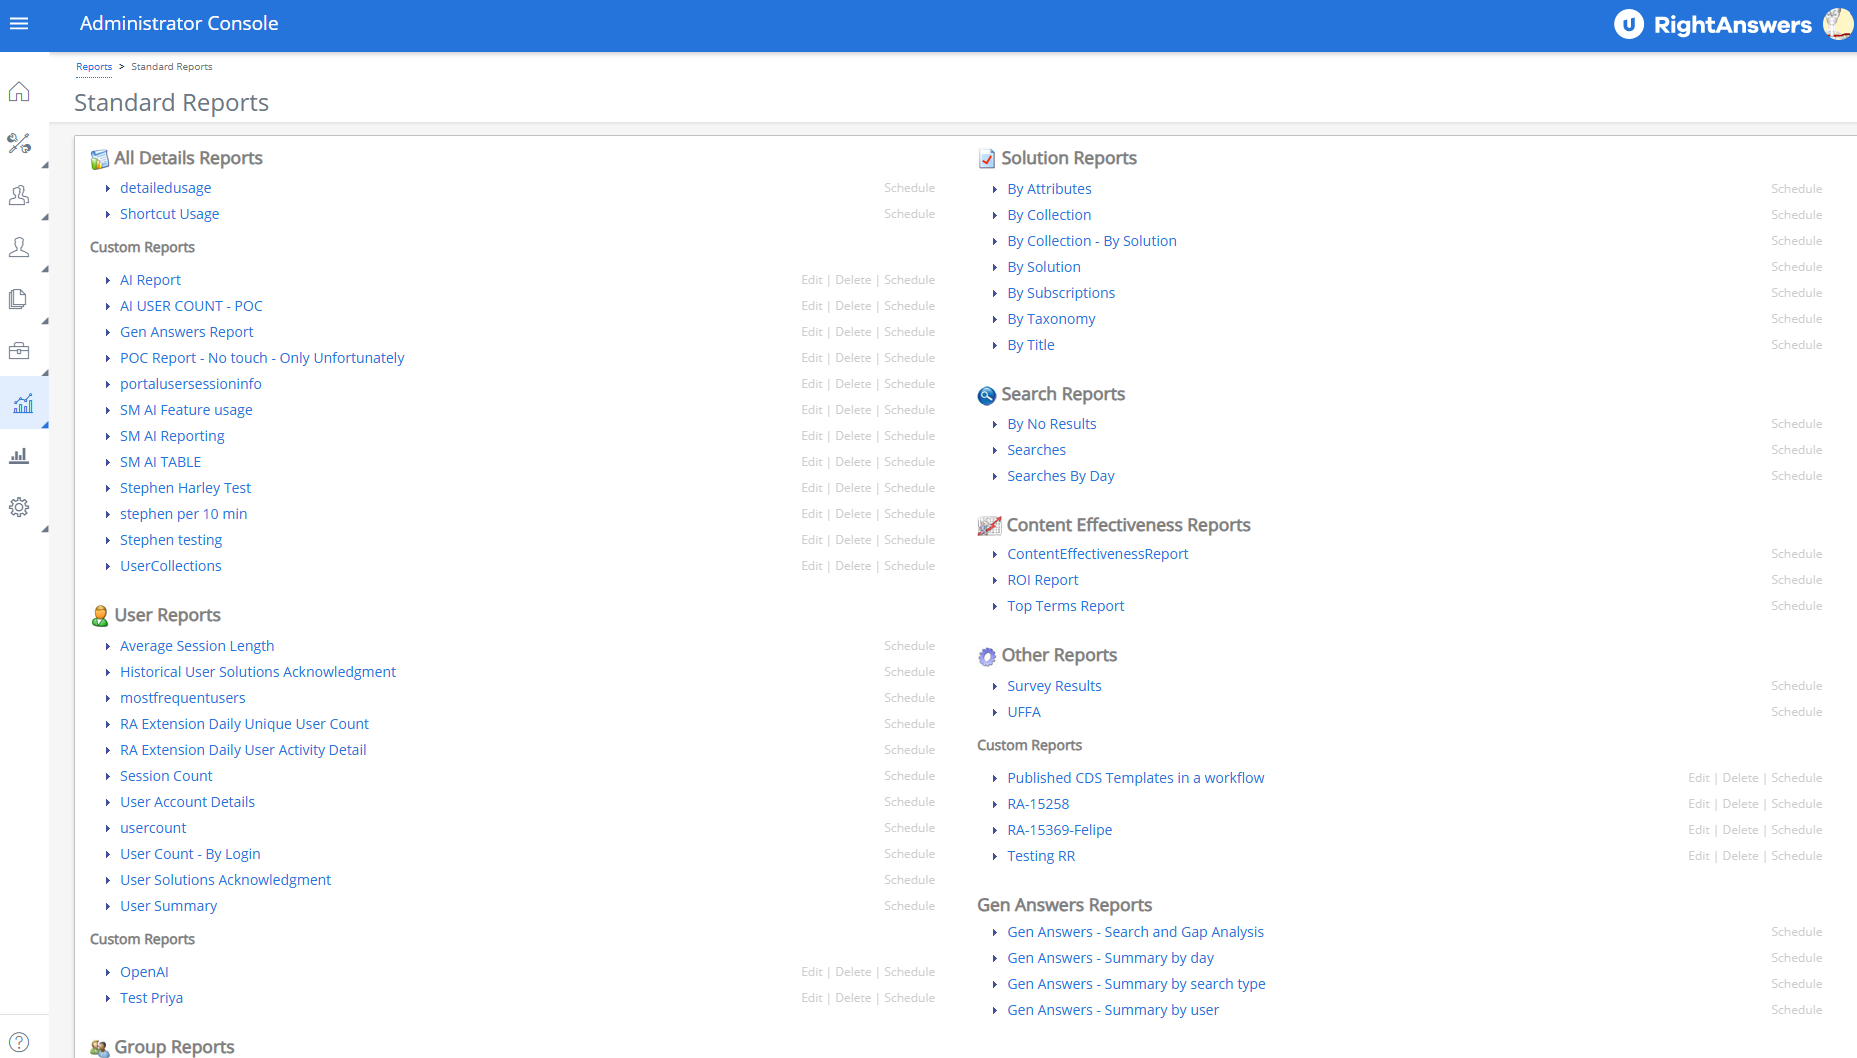
Example of the Portal Reports page. Click to enlarge.
The available Standard Portal Reports include:
All Details Reports
-
Detailed Usage: All data regarding usage arranged by the following columns: Date and Time, Login, Action, Description, Result, Session ID, Solution ID, Browse Path, Type Of View, and Group ID.
 NOTE: You can generate a report on the usage of RightAnswers Browser Extension by setting the Access Method to RA-Extension.
 -
Shortcut Usage: All data regarding which shortcuts are being clicked on within the Self-Service and Support Agent portals.
User Reports
-
Average Session Length: Number of sessions per day and the average session time in minutes.
-
Historical User Solutions Acknowledgement: Displays users acknowledgments between From-To including deleted and archived solutions.
-
Most Frequent Users: Number of actions, by username, to determine the most frequent users.
-
Session Count: Number of sessions users entered into the portal on a specific date.
-
User Account Details: Displays details of users created within the selected date range and belonging to the selected portal group.
-
User Count: Number of unique users using the portal over the lifetime of the portal displayed by date.
-
User Count - By Login: Number of sessions per username over the time interval.
-
User Solutions Acknowledgement: Displays users acknowledgments between From - To (date filter) for all solutions currently set for tracking including deleted and archived solutions. The report doesn't’t display solutions set for tracking if no users acknowledged it ever or between From-To.
-
User Summary: Number of searches, solution views, solved issues, and opened tickets by username.
-
User Time In Solution: User time spent in each solution (measured in seconds).
Group Reports
-
Portal AI Licensing: This report displays the number of unique active users in each portal group for companies where AI Answer Generation is enabled.
-
Summary Usage: Summary by Group of the usage including unique users, session, searches, solution views, solved issues, not solved issues, open tickets, and ticket summary views.
Adoption Reports
-
New vs. Returning Users: A high number of new users suggests that you are successful at driving traffic to the Portal while a high number of return users suggests that the content within the Portal is engaging enough for users to come back. This report is binned by month and contains the number of total unique individual users (UNIQUE USERS), the number of the unique individual users that are first time users in the given period (NEW USERS), the number of users that have been to the portal one or more times in the given period (REPEAT USERS), as well as the percentage of overall users that have been to the portal one or more times (REPEAT PERCENTAGE).
NOTE:Each month's usage is compared to the previous months within the selected timeframe. The First month of analysis will not have any repeat usage as it acts as a baseline for further analysis.
-
User Loyalty: Loyal users are usually highly engaged with the portal and a high number of multiple visits indicate good user retention. This report displays the total number of visits within a given timeframe (NUMBER OF VISITS), with the corresponding number of users that have visited (USERS) as well as the percentage of total visits for each row (PERCENTAGE OF TOTAL VISITS).
Solution Reports
-
By Attributes: Number of solution views by attribute
-
By Solution: Number of views, solved issues, not solved issues, and solution open tickets by solution ID
-
By Subscriptions: Number of users subscribed to a solution. By using the user filter option, it is possible to find which solutions a user is subscribed to
-
By Taxonomy: Number of solution views by taxonomy path
-
By Title: Number of solution views by title, which is the second level of taxonomy
Search Reports
-
By No Results: View searches completed based on No clicks for a particular date range
-
Searches: View searches completed for a particular date range
-
Searches By Day: View searches completed by day for a particular date range. The report also lists the search type (Keyword, Neural or Hybrid) for each search performed.
You can filter the search reports by Access Method, Groups, and Filtered Collection.
Content Effectiveness Reports
-
Content Effectiveness Report: Determining whether or not a user had a positive portal experience, was able to effectively search and locate the answer to their issue, as well as being able to provide the right quantity, quality and coverage of content for users is essential to the success of the Portal. Content Effectiveness is the terminology used to describe the process of evaluating these factors. This report contains a series of charts and tables binned by month for a given time period detailing the content effectiveness for the portal.
-
ROI (Return on Investment Report) Report: This report displays numbers to see how the portal usage may be resolving incidents and reducing the number of help desk calls and open tickets.
-
Top Terms Report: Knowing what individual words do not yield the answers users are searching for is the most valuable analytical data as it relates to content. This report lists all the unique individual words contained in each search phrase and the associated overall success rate when that word is used. A positive session is one where a user explicitly acknowledges a success (clicks YES) or where it is implicitly considered a success (no negative actions such as clicking NO or Opening an Incident). Each search term is a hyperlink allowing you to drill down further into each word to expose all of the associated sessions for deeper evaluation.
Other Reports
-
UFFA: Number of tickets a self-service user has opened on the service desk/CRM platform, searches, Use it - number of solved solutions, Fix it - number of solutions edited, Flag it - number of solutions flagged, and Add it - number of solutions submitted to solution manager.
-
Survey Results: This report displays the survey name and users who participated in the survey and the time when survey was taken by the user. It also displays the survey questions, the answers and comments by a solution and survey taken date/time.
Custom Reports
In addition to the Standard Reports, company-created custom reports are included in each report category. For additional information on creating reports, see Creating Reports with Report Builder.
Gen Answers Reports
-
Gen Answers - Search and Gap Analysis - This report analyzes the gap between AI Assistant search results and the expected answers by capturing each query, search type, response accuracy, the reference solutions used, Mean Reciprocal Rank (MRR), and context sets to evaluate and improve knowledgebase search performance. MRR assesses and ranks search results based on the position of the first relevant result within the context set (the set of solutions sent to the model to answer the question), considering the highest MRR value when multiple references are provided. This report considers only generative answers with no follow-up queries.
-
Gen Answers - Summary by day - This report enables you to easily analyze the adoption of Generative Answers and the training needed to make it more effective. It provides a daily summary of total questions, counts of answered and unanswered questions with their respective percentages, reference solution views, and AI response rates.
-
Gen Answers - Summary by search type - This report displays a comprehensive breakdown of the performance of Generative Answers across Neural, Hybrid, and Keyword methodologies to help you analyze and compare the effectiveness of different search methods. It displays total questions, answered and unanswered counts with their respective percentages.
-
Gen Answers - Summary by user - This report enables you to monitor the usage of the Generative Answers on the portal by users of various portal groups. It provides a user-wise summary of total questions, counts of answered and unanswered questions with their respective percentages, reference solution views, and AI response rates for a chosen date range.