Reports Tab
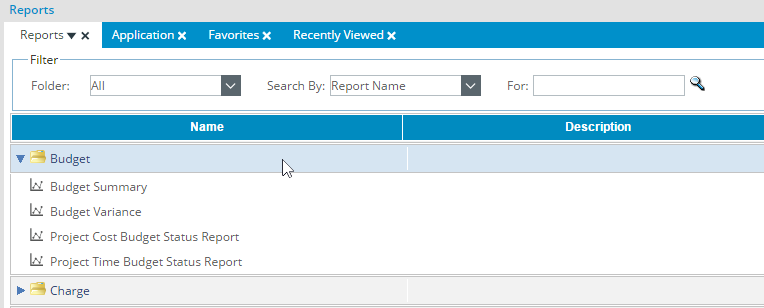
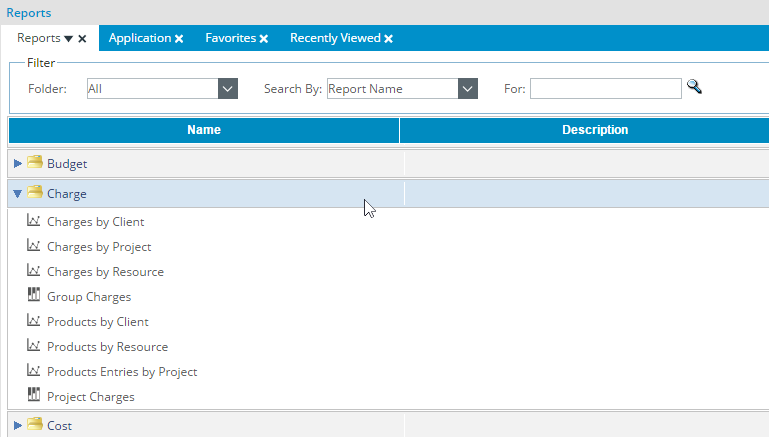
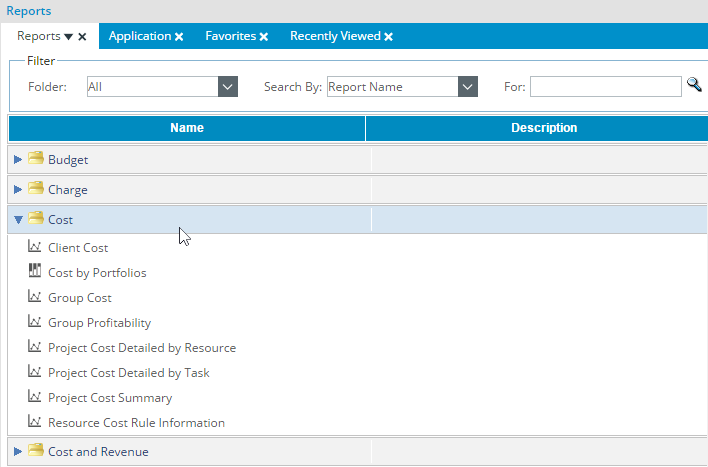
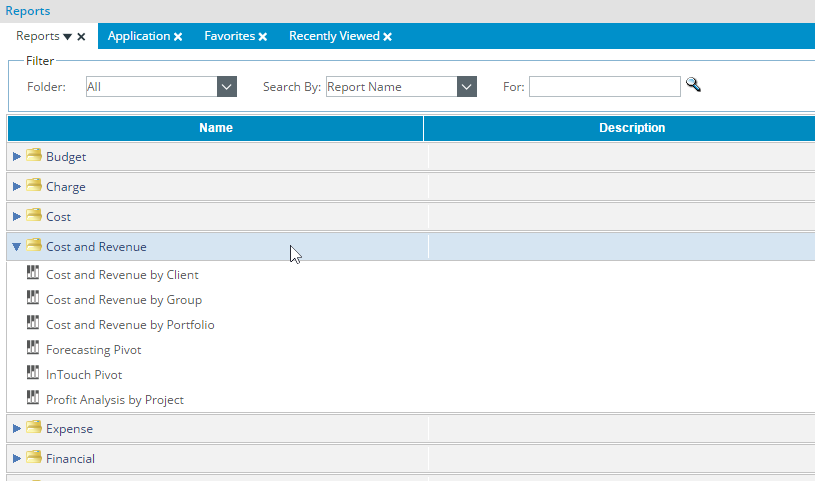
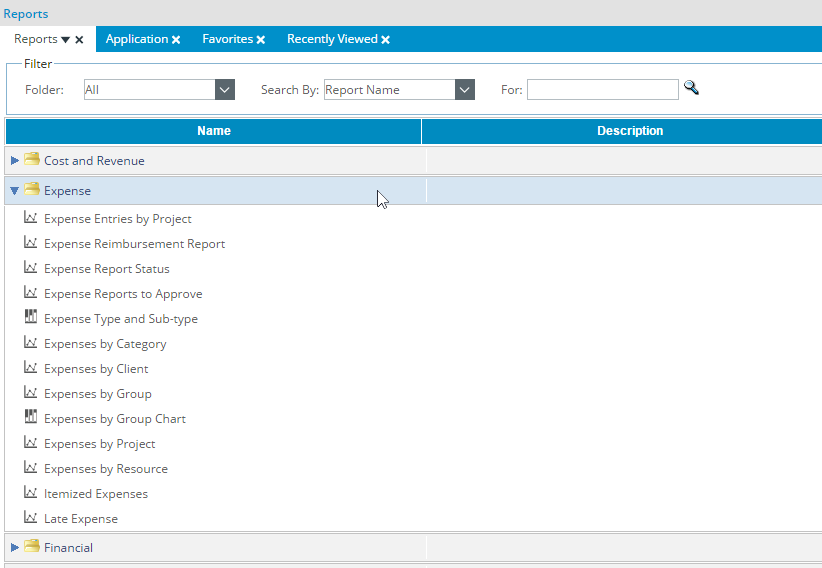
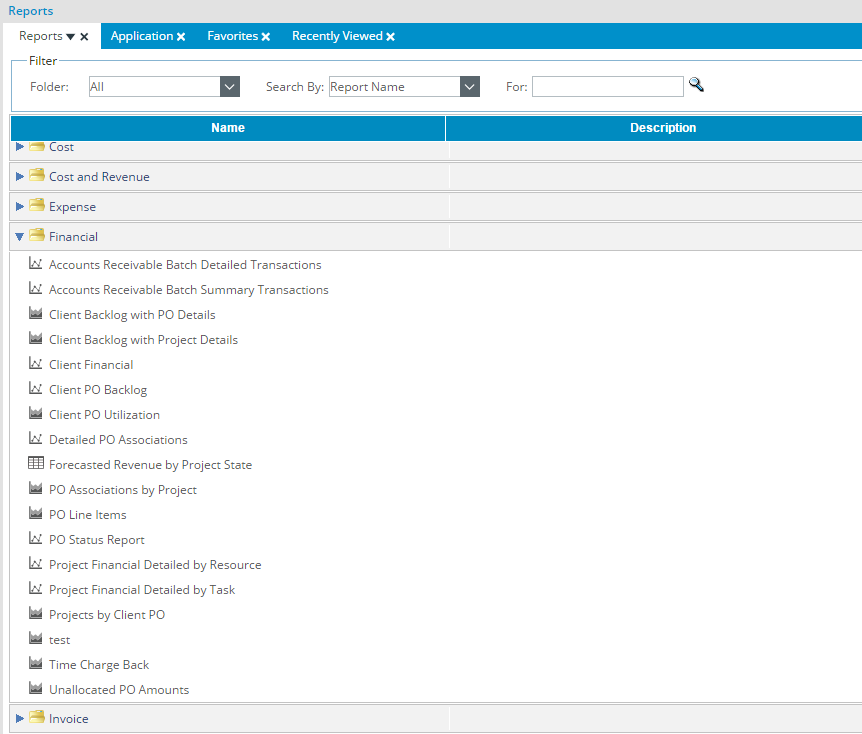
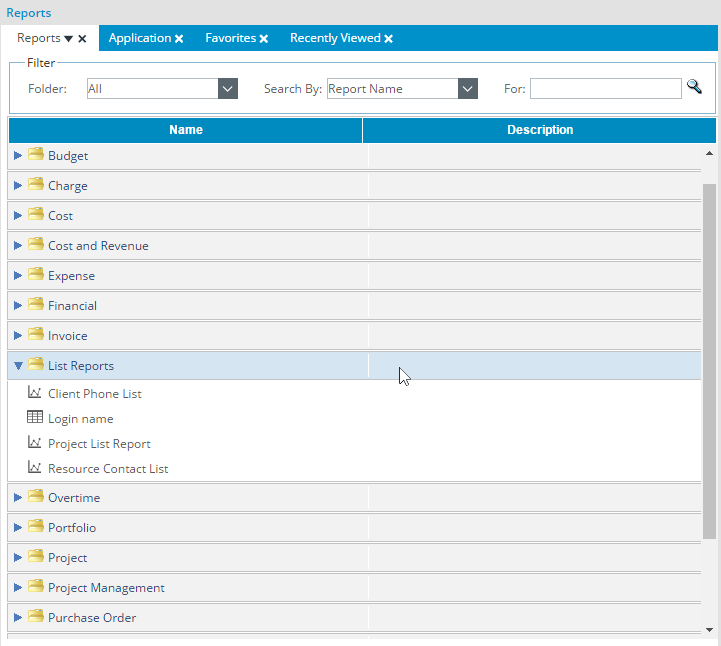
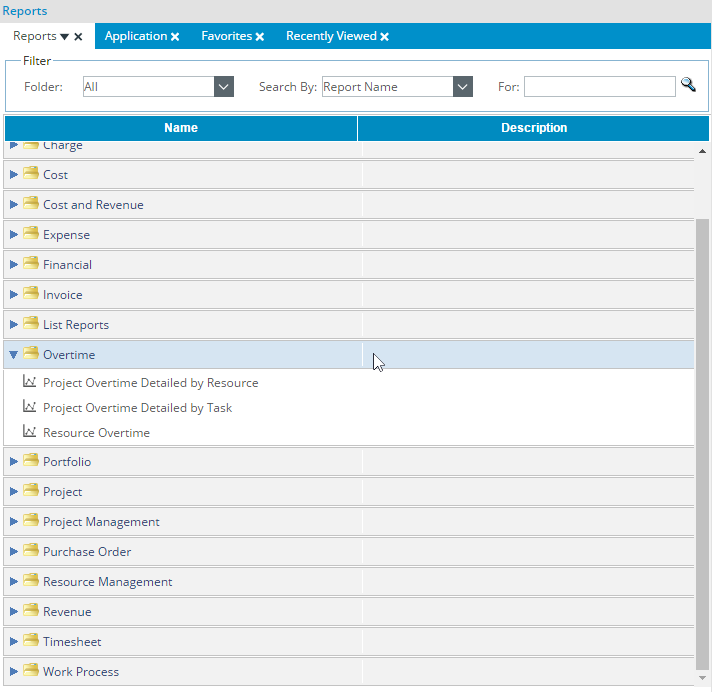
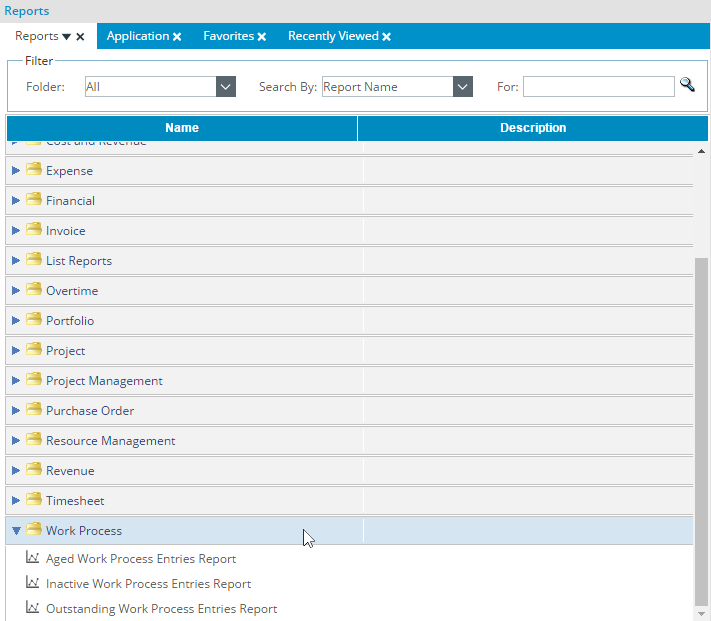
The Reports tab displays all the reports currently available in the system with the exception of the application reports. From the Reports tab, the following folders containing the out-of-box RDLC reports are displayed:
- Budget Folder
- Charge Folder
- Cost Folder
- Cost and Revenue Folder
- Expense Folder
- Financial Folder
- Invoice Folder
- List Reports Folder
- Overtime Folder
- Portfolio Folder
- Project Folder
- Project Management Folder
- Purchase Order Folder
- Resource Management Folder
- Revenue Folder
- Timesheet Folder
- Work Process Folder
Budget Folder
The Budget folder contains the following reports:
- Budget Summary Report
- Budget Variance Report
- Project Cost Budget Status Report
- Project Time Budget Status Report
Budget Summary Report
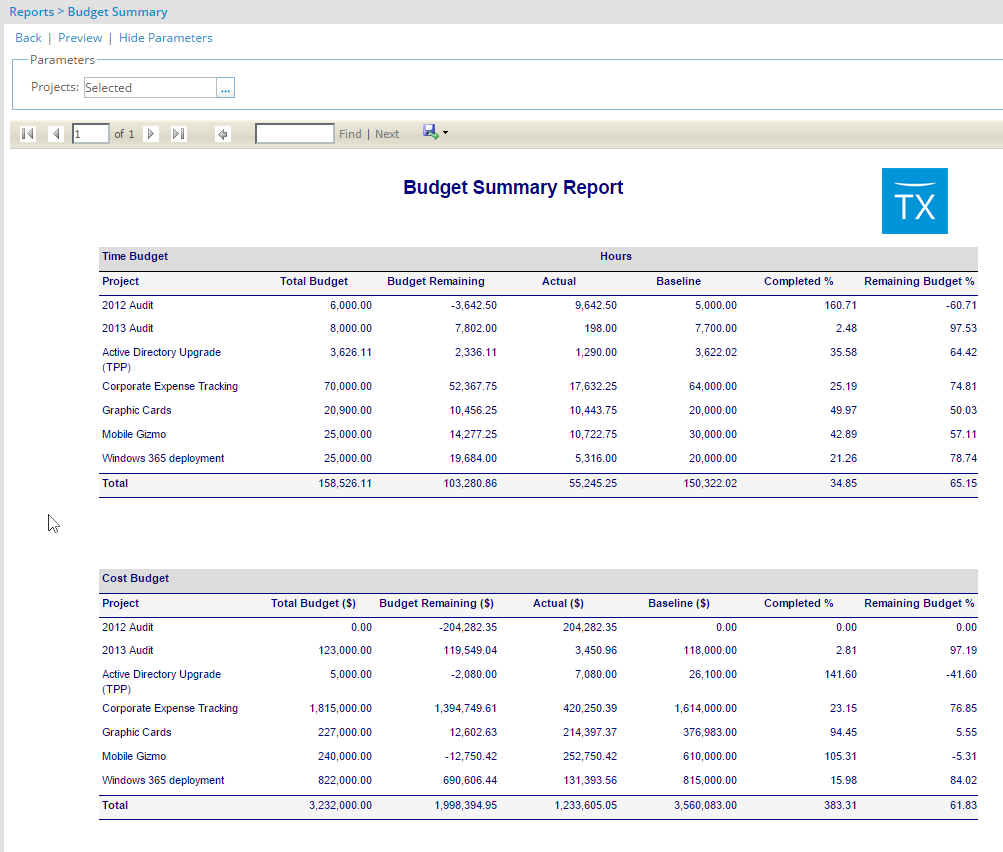
The Budget Summary Report displays a summary of the budget time and cost information for each selected project, as well as the totals.
From the Time Budget grid, the following information is displayed per project:
- Total Budget: sum of all the project's current time budgets
- Budget Remaining: sum of all the time entries entered against the project
- Actual: sum of actual time entered against the project
- Baseline: sum of all the project's budgets' summary baseline time budget
- Completed %: calculated as Actual/Total Budget * 100
- Remaining Budget %: calculated as Budget Remaining/Total Budget * 100
From the Cost grid, the following information is displayed for a project in the system currency:
- Total Budget ($): sum of all the project's current cost budgets
- Budget Remaining ($): sum of all cost (time, expense, charge and product) entered against the project
- Actual ($): sum of actual cost (time, expense, charge and product) entered against the project
- Baseline ($): sum of all the project's budgets' summary baseline cost budget
- Completed %: calculated as Actual ($)/Total Budget ($) * 100
- Remaining Budget %: calculated as Budget Remaining ($)/Total Budget ($) * 100.
Budget Variance Report
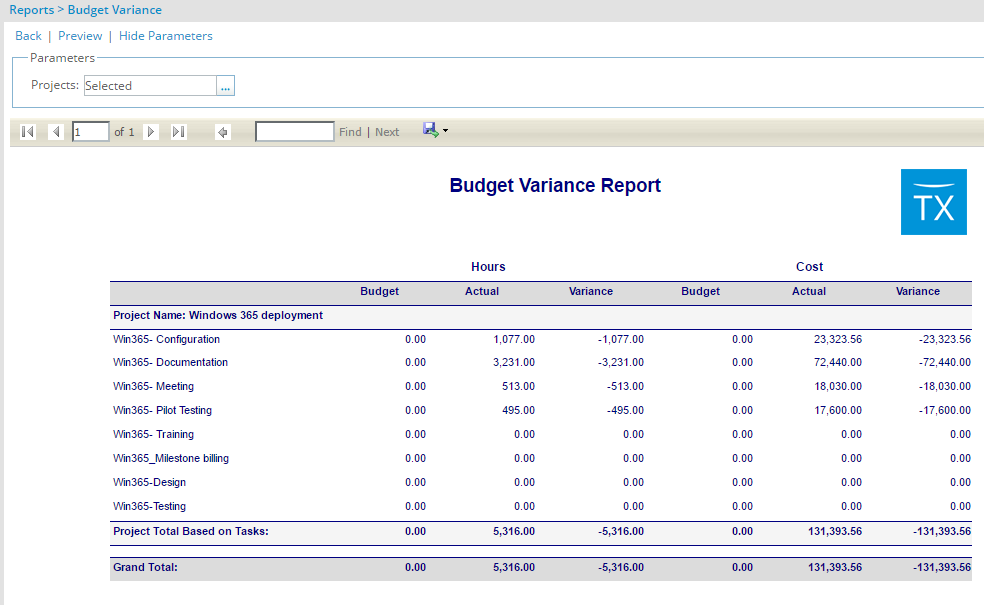
The Budget Variance Report displays the variances between the actual performance and the budget for each selected project, as well as the project totals based on the tasks. From the Budget Variance Report, the information is displayed by cost and hours for each task.
The Hours columns display the following information:
- Budget: sum of all the task's current time budgets
- Actual: sum of all time entries entered against the task
- Variance: calculated as Budget – Actual
Version note: Available as of Tenrox 2011 R1, the Start Date and End Date parameters are removed and Labor($) is renamed Cost in the Budget Variance Report.
The Cost columns display the following information in the system currency:
- Budget: sum of all the task's current cost budgets
- Actual: sum of all the cost (time, expense, charge and product) entered against the task
- Variance: calculated as Budget – Actual
Project Cost Budget Status Report
Version note: Available as of Tenrox 2011 R1
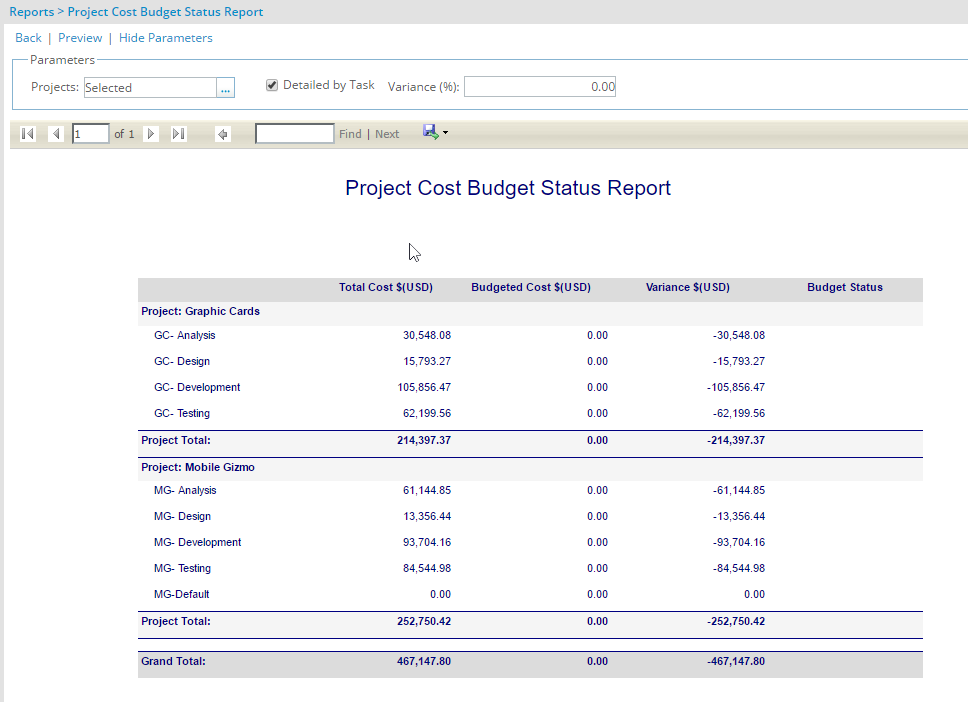
The Project Cost Budget Status Report displays the total cost, budgeted cost, variance and budget status for each selected project, as well as the project and grand totals. To determine the variance for each selected project, a percentage is entered in the Variance (%) box. The Project Cost Budget Status Report also displays the budget information per task when the Detailed by Task check box is selected. If the Detailed by Task check box is not selected, the data is displayed per project and the project budget is used.
Note: The leave time tasks are not included in the Project Cost Budget Status Report.
The Project Cost Budget Status Report grid displays the following information for each project or task:
- Total Cost: actual total cost of the project or task
- Budgeted Cost: current cost of the project or task budget
- Variance: calculated as Budgeted Cost – Total Cost
- Budget Status: color-coded indicators represent the status of the budge
No icon: current budget amount = 0 or budget does not exist
Red icon: current budget amount < or > 0 and budget variance is negative (Variance % of current budget amount)
Yellow icon: budget variance = 0 is negative (Variance % of current budget amount)
Green icon: budget variance >or = 0
Project Time Budget Status Report
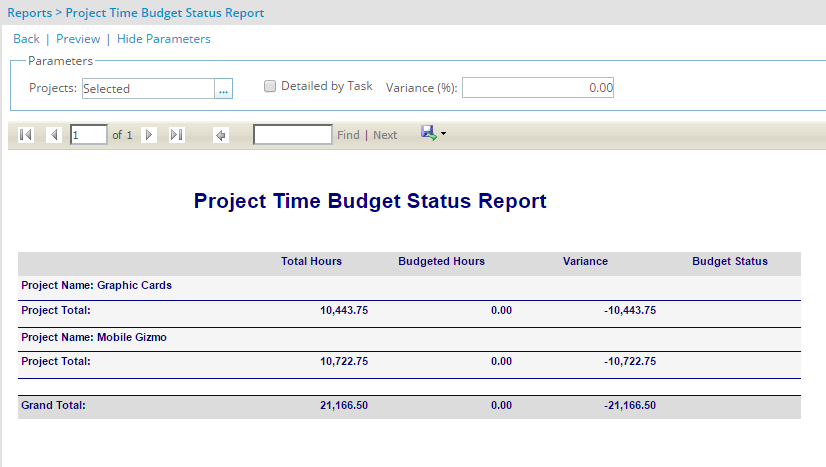
The Project Time Budget Status Report displays the total hours, budgeted hours, variance and budget status for each selected project, as well as the project and grand totals. To determine the variance for each selected project, a percentage is entered in the Variance (%) box. The Project Time Budget Status Report also displays the budget information per task when the Detailed by Task check box is selected. If the Detailed by Task check box is not selected, the data is displayed per project and the project budget is used.
Version note: Available as of Tenrox 2011 R1, the Project Budget Utilization report is renamed Project Time Budget Status.
The Project Time Budget Status Report grid displays the following information per project or task:
- Total Hours: actual total hours for the project or task
- Budgeted Hours: current hours for the project or task budget
- Variance: calculated as Budgeted Hours – Total Hours
- Budget Status: color-coded indicators represent the status of the budget
No icon: current budget amount = 0 or budget does not exist
Red icon: current budget amount < or > 0 and budget variance is negative (Variance % of current budget amount)
Yellow icon: budget variance = 0 is negative (Variance % of current budget amount)
Green icon: budget variance >or = 0
Charge Folder
The Charge folder contains the following reports:
- Charges by Client Report
- Charges by Project Report
- Charges by Resource Report
- Products by Client Report
- Products by Resource Report
- Product Entries by Project Report
Note: The Charge folder also contains the Group Charges and Project Charges Online Analytical Processing (OLAP) reports as long as OLAP licenses exist.
Charges by Client Report
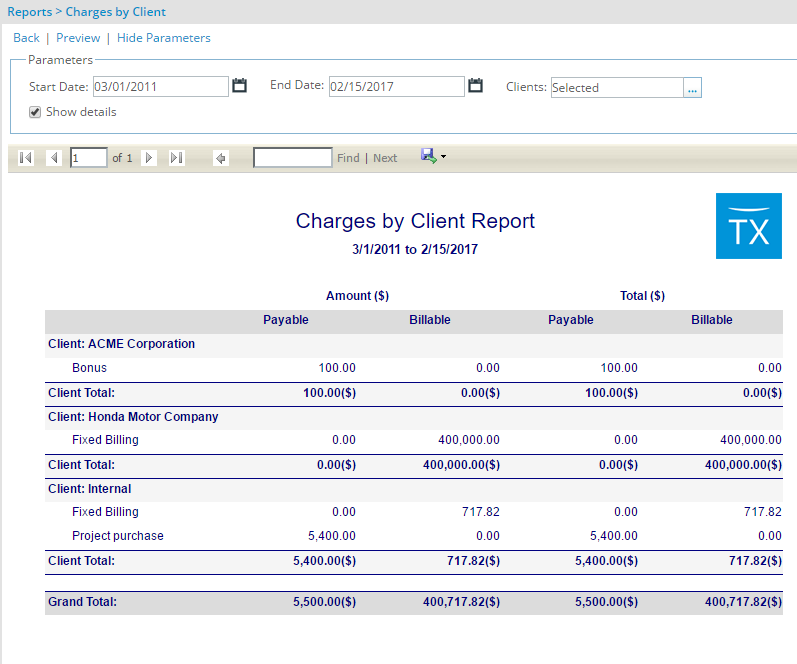
- The Charges by Client Report displays the payable and billable charge amounts and corresponding totals by client, as well as the client and grand totals. To run the Charges by Project Report, specify the date range for the selected clients. The Charges by Client Report also displays the information by client and charge item when the Show details check box is selected.
Charges by Project Report
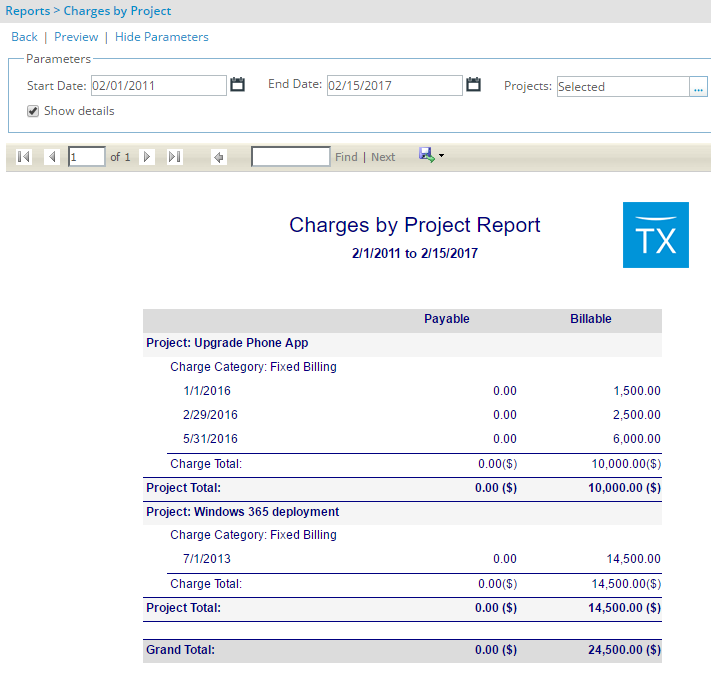
- The Charges by Project Report is grouped by project and displays the payable and billable charge amounts per charge type, as well as the project and grand totals. To run the Charges by Project Report, specify the date range for the selected projects. The Charges by Project Report also displays the information by project and charge item when the Show details check box is selected.
Charges by Resource Report
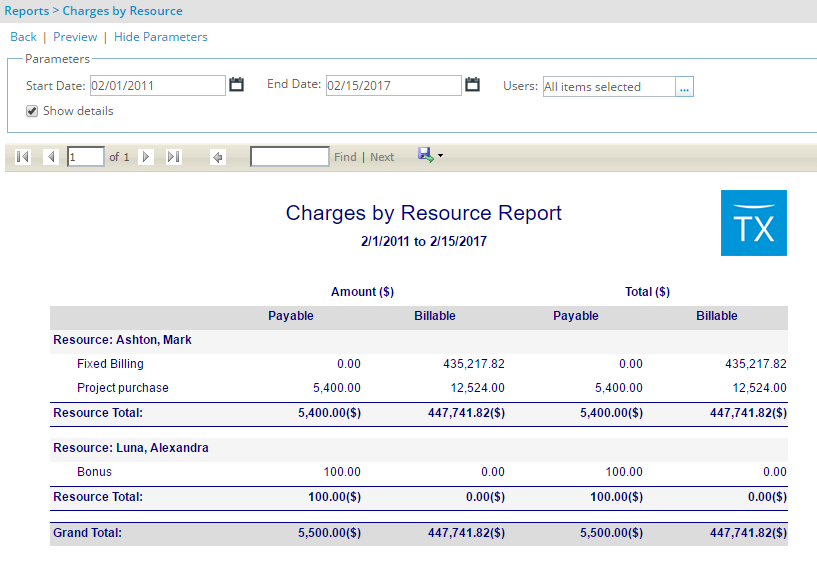
- The Charges by Resource Report is grouped by resource and displays the payable and billable charge amounts and corresponding totals per charge type, as well as the resource and grand totals. To run the Charges by Resource Report, specify the date range for the selected resources. The Charges by Resource Report also displays the information by resource and charge item when the Show details check box is selected.
Products by Client Report
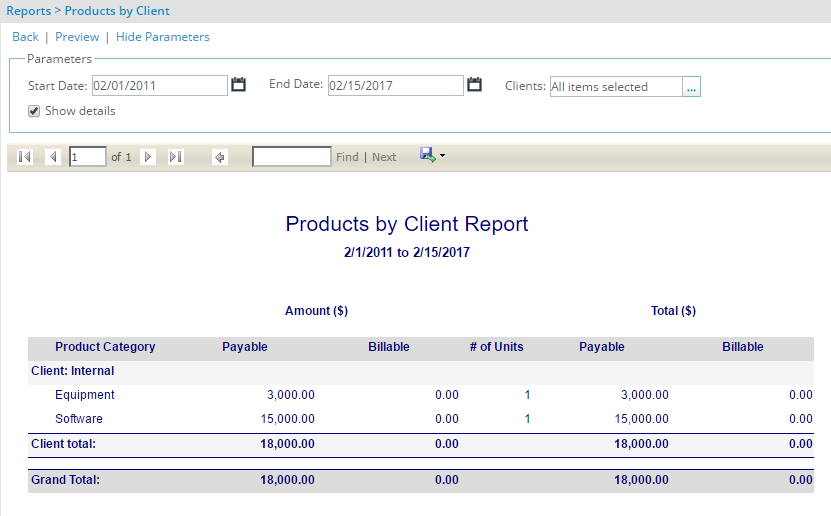
- The Products by Client Report is grouped by client and displays the payable and billable product amounts by the number of units and the corresponding totals per product type, as well as the client and grand totals. To run the Products by Client Report, specify the date range for the selected clients. The Products by Client Report also displays the information by client and product item when the Show details check box is selected.
Products by Resource Report
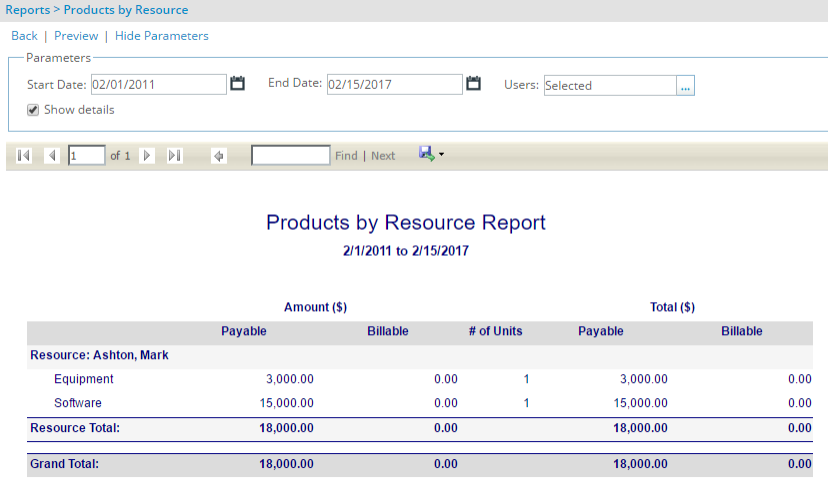
- The Products by Resource Report is grouped by resource and displays the payable and billable product amounts by the number of units and corresponding totals per product type, as well as the resource and grand totals. To run the Products by Resource Report, specify the date range for the selected resources. The Products by Resource Report also displays the information by resource and product item when the Show details check box is selected.
Product Entries by Project Report
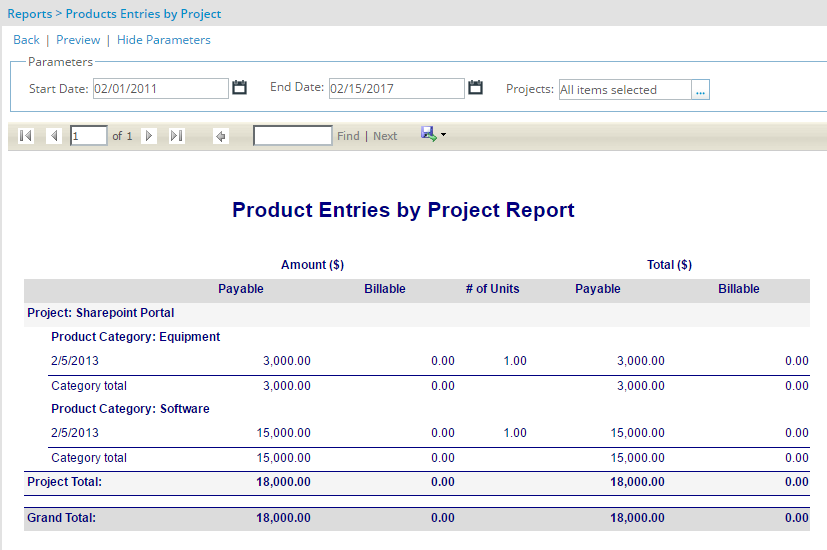
The Product Entries by Project Report is grouped by project and displays the payable and billable product entry amounts by the number of units and corresponding totals per product type, as well as the category, project and grand totals. To run the Product Entries by Project Report, specify the date range for the selected projects.
Note: The product entries are grouped per product type and each product entry displays its entry date.
Cost Folder
The Cost folder contains the following reports:
- Client Cost Report
- Group Cost Report
- Group Profitability Report
- Project Cost Detailed by Resource Report
- Project Cost Detailed by Task Report
- Project Cost Summary Report
- Resource Cost Rule Information Report
Note: The Cost folder also contains the Cost by Portfolios OLAP report as long as OLAP licenses exist.
Client Cost Report
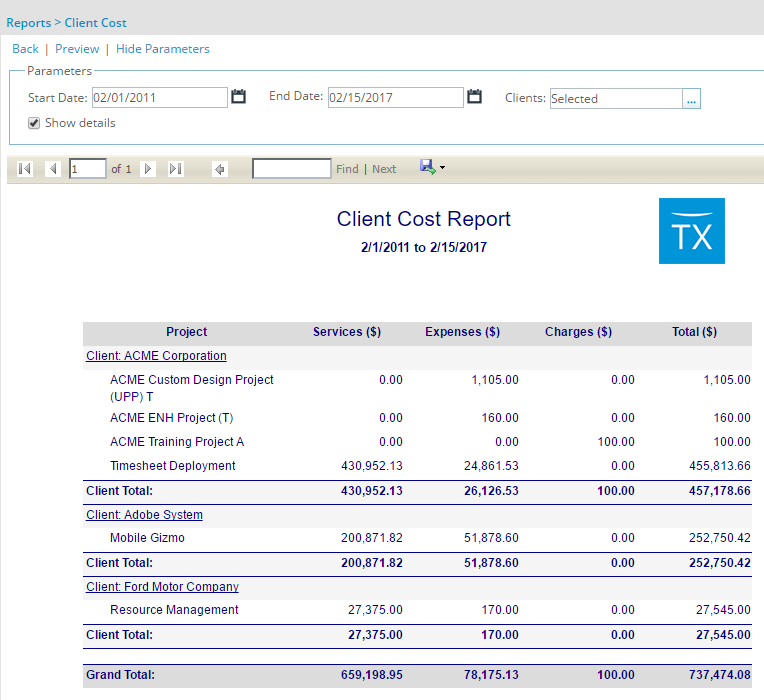
- The Client Cost Report displays the services, expenses, charges and total cost amount by client, as well as the client and grand totals. To run the Client Cost Report, specify the date range for the selected clients. The Client Cost Report also displays the cost information by client and project when the Show details check box is selected.
Group Cost Report
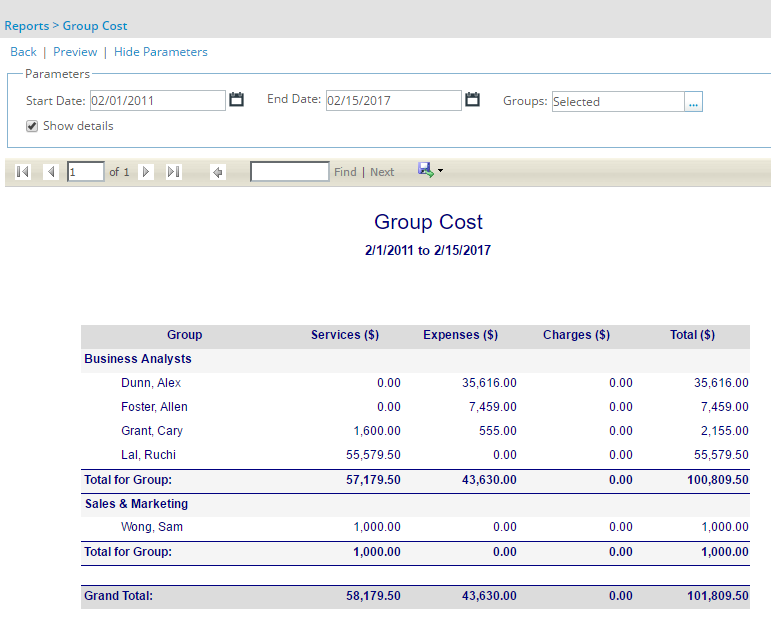
- The Group Cost report displays the services, expenses, charges and total cost amount by resource group, as well as the group and grand totals. To run the Group Cost report, specify the date range for the selected groups. The Group Cost report also groups the costs by resource group and displays the cost information per resource when the Show details check box is selected.
Group Profitability Report
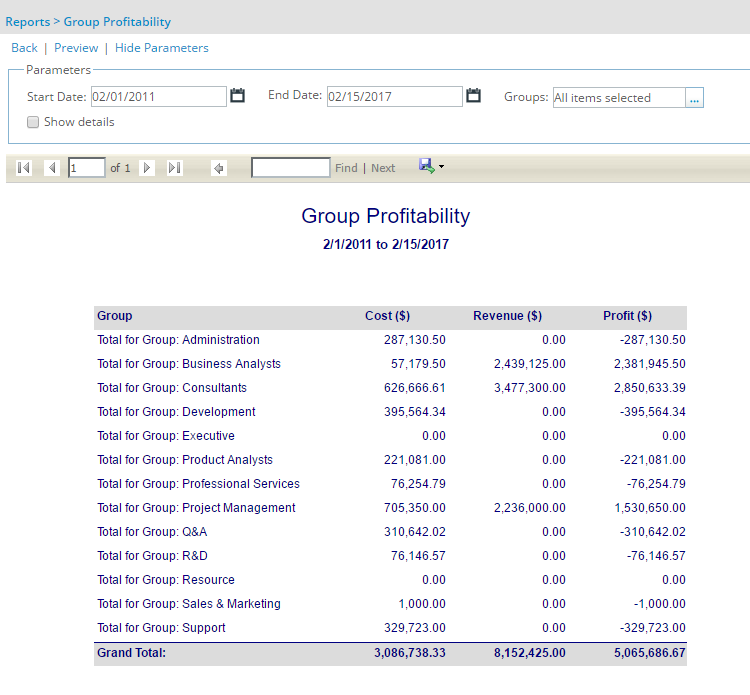
- The Group Profitability report displays the cost, revenue and profit (Revenue – Cost) by resource group, as well as the group and grand totals. To run the Group Profitability report, specify the date range for the selected groups. The Group Profitability report also groups the costs by resource group and displays the cost information per resource when the Show details check box is selected.
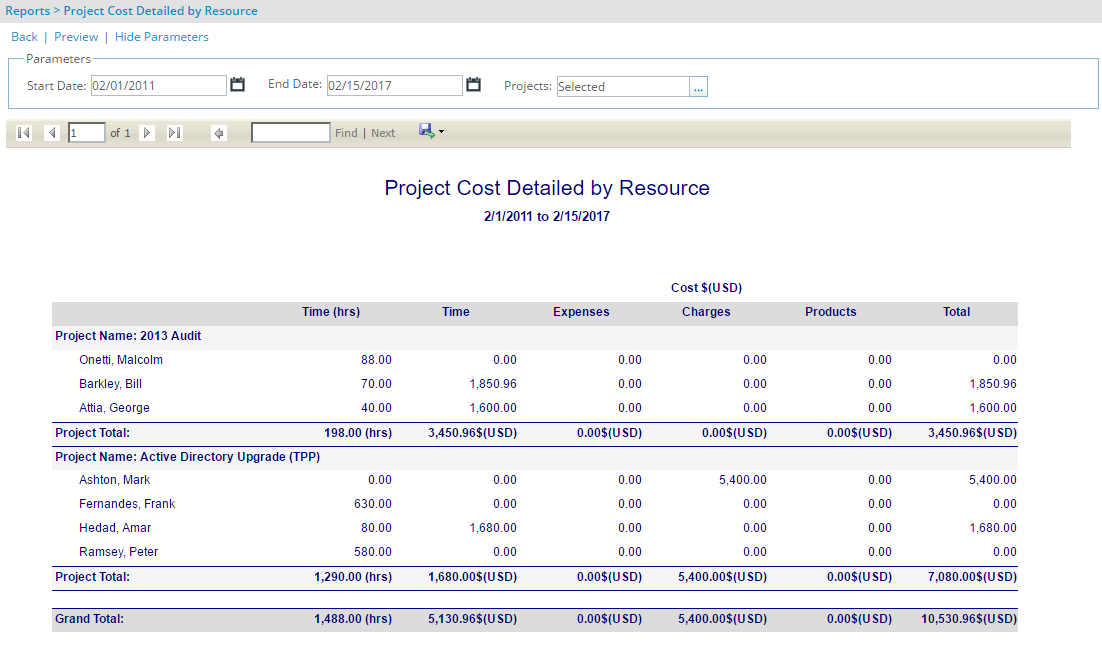
Project Cost Detailed by Resource Report
- The Project Cost Detailed by Resource report displays by project, the total hours, total time cost, total expense cost, total charge cost and total product cost per resource, as well as the project and grand totals. To run the Project Cost Detailed by Resource report, specify the date range for the selected projects.
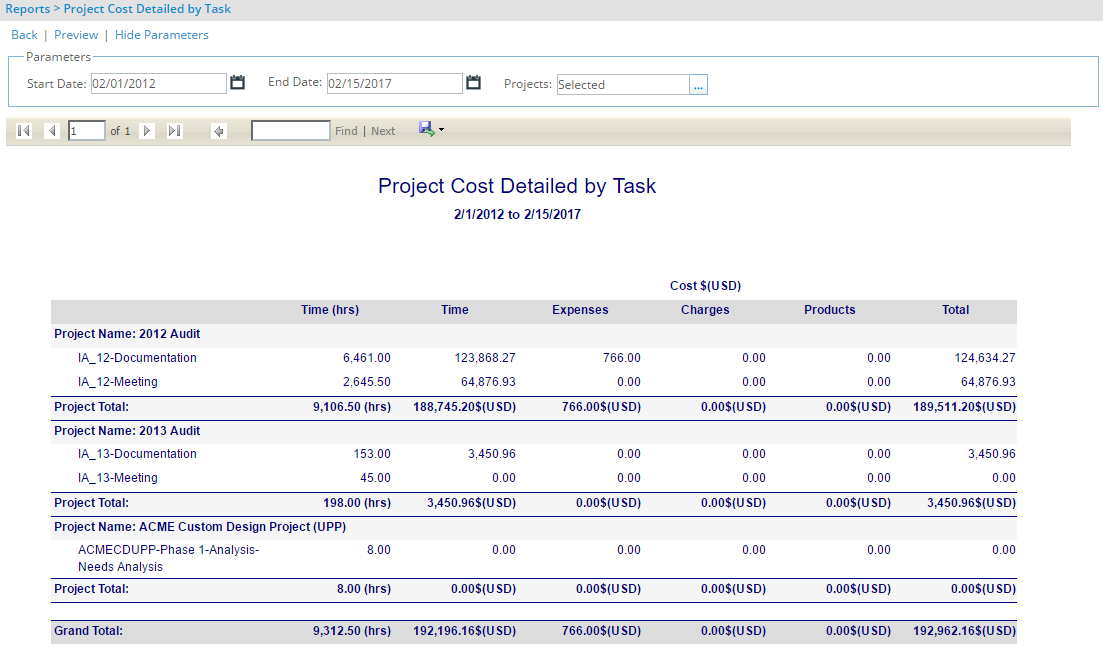
Project Cost Detailed by Task Report
- The Project Cost Detailed by Task report displays by project, the total hours, total time cost, total expense cost, total charge cost and total product cost per task, as well as the project and grand totals. To run the Project Cost Detailed by Task report, specify the date range for the selected projects.
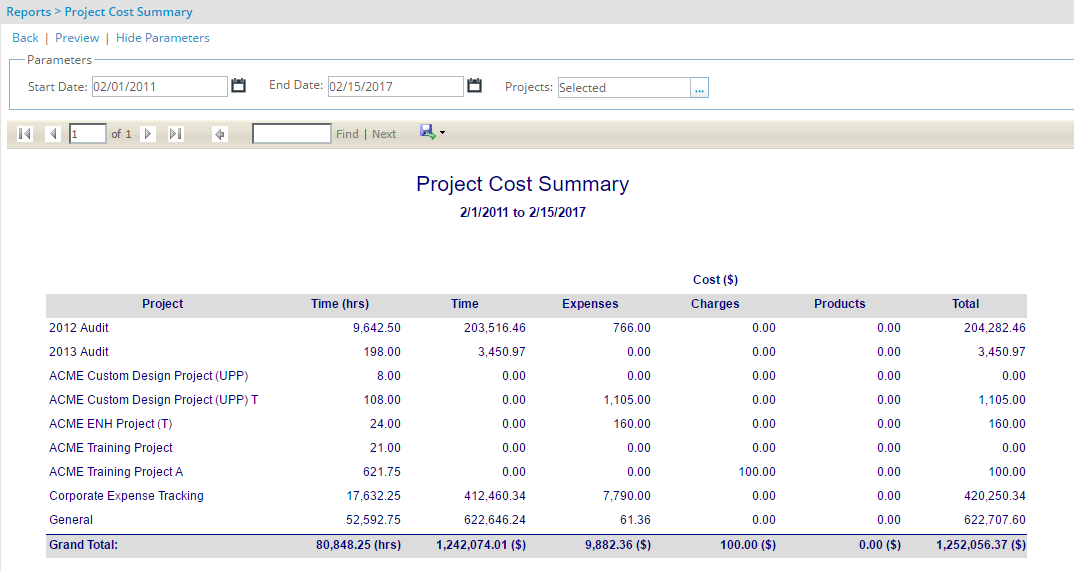
Project Cost Summary Report
- The Project Cost Summary report displays a summary of the total hours, total time cost, total expense cost, total charge cost, total product cost and corresponding totals by project, as well as the grand total. To run the Project Cost Summary report, specify the date range for the selected projects.
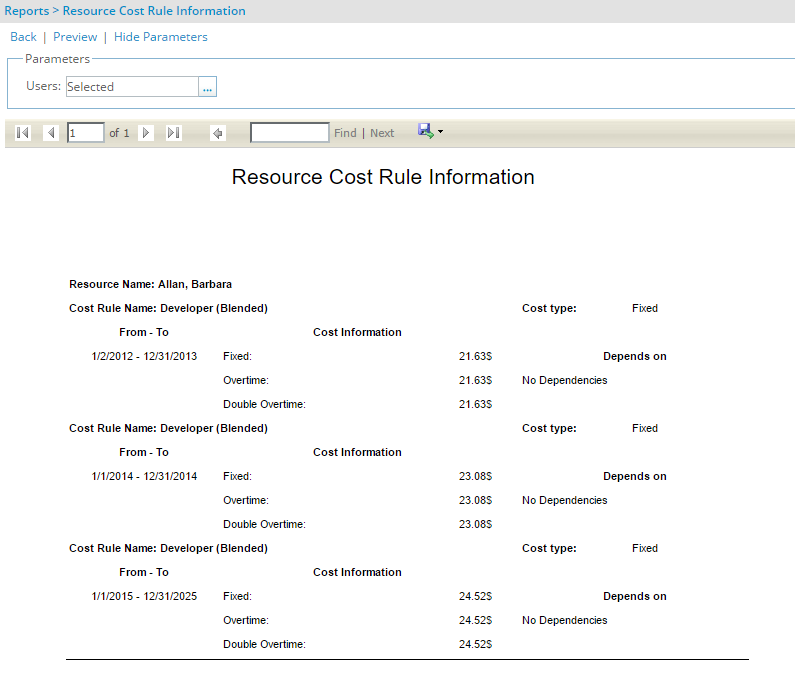
Resource Cost Rule Information Report
- The Resource Cost Rule Information report displays the cost rule associations with their dates, rates and dependencies for the selected resources.
Cost and Revenue Folder
The Cost and Revenue folder is available only when the OLAP licenses exist. The Cost and Revenue folder contains the following OLAP reports:
- Cost and Revenue by Client
- Cost and Revenue by Group
- Cost and Revenue by Portfolio
- Profit Analysis by Project
Expense Folder
The Expense folder contains the following reports:
- Expense Entries by Project Report
- Expense Reimbursement Report
- Expense Report Status Report
- Expense Reports to Approve Report
- Expenses by Category Report
- Expenses by Client Report
- Expenses by Group Report
- Expenses by Project Report
- Expenses by Resource Report
- Itemized Expenses Report
- Late Expense Report
Note: The Expense folder also contains the Expense Type and Sub-type and Expenses by Group Chart OLAP reports as long as OLAP licenses exist.
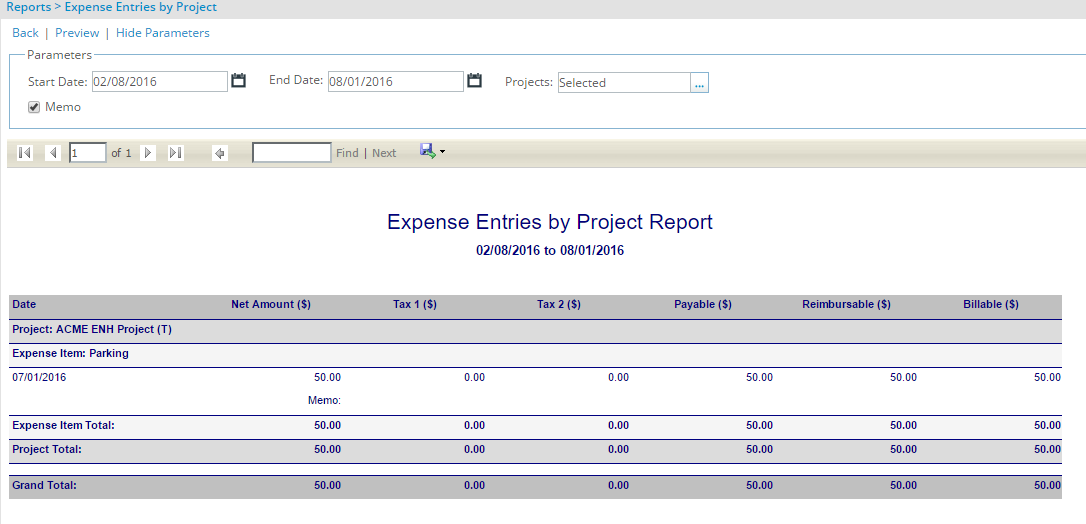
Expense Entries by Project Report
- The Expense Entries by Project Report displays by project, the net amounts, the taxes, as well as the payable, reimbursable and billable amounts per expense item. The expense items are also displayed by date, as well as the project and grand totals. To run the Expense Entries by Project Report, specify the date range for the selected projects. The Expense Entries by Project Report also displays the memo entries by project when the Memo check box is selected.
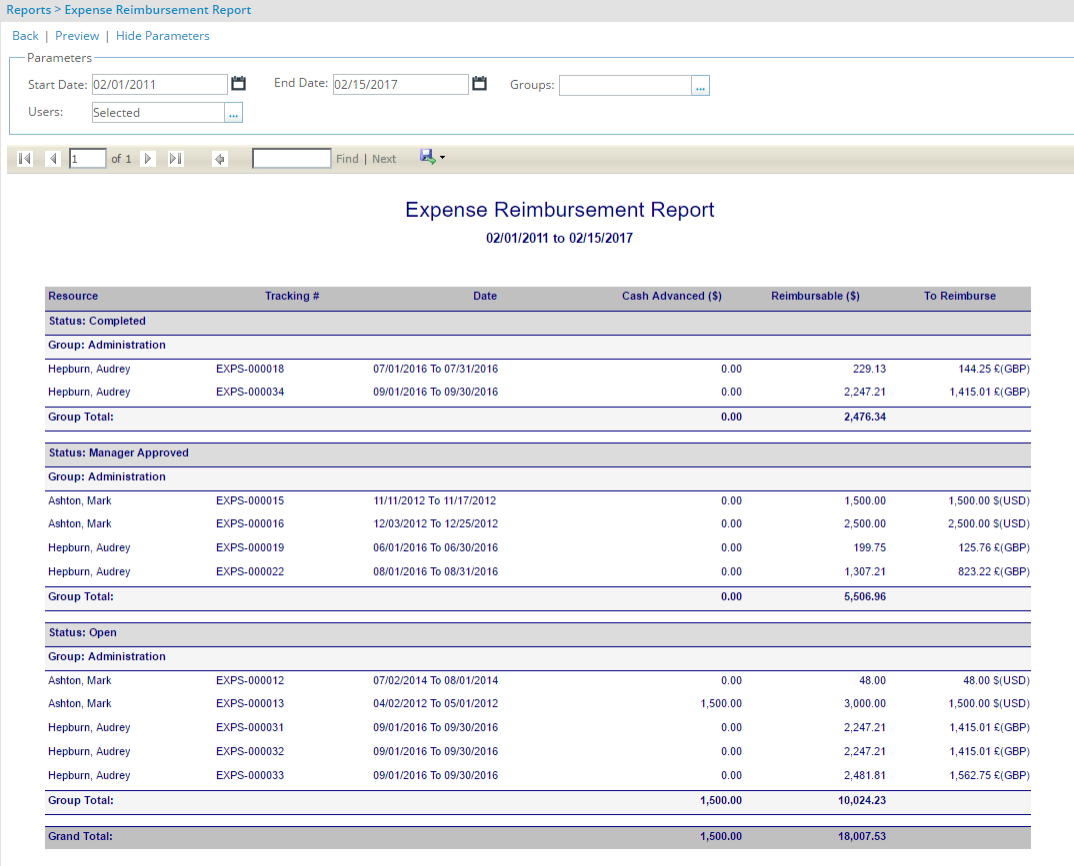
Expense Reimbursement Report
- The Expense Reimbursement Report displays the expense reports by state, resource group and resource, as well as group and grand totals. The Expense Reimbursement Report displays the tracking number, date, cash advanced amount, reimbursable amount, amount to reimburse by resource. To run the Expense Reimbursement Report, specify the date range for the selected resource groups and corresponding resources.
Expense Report Status Report
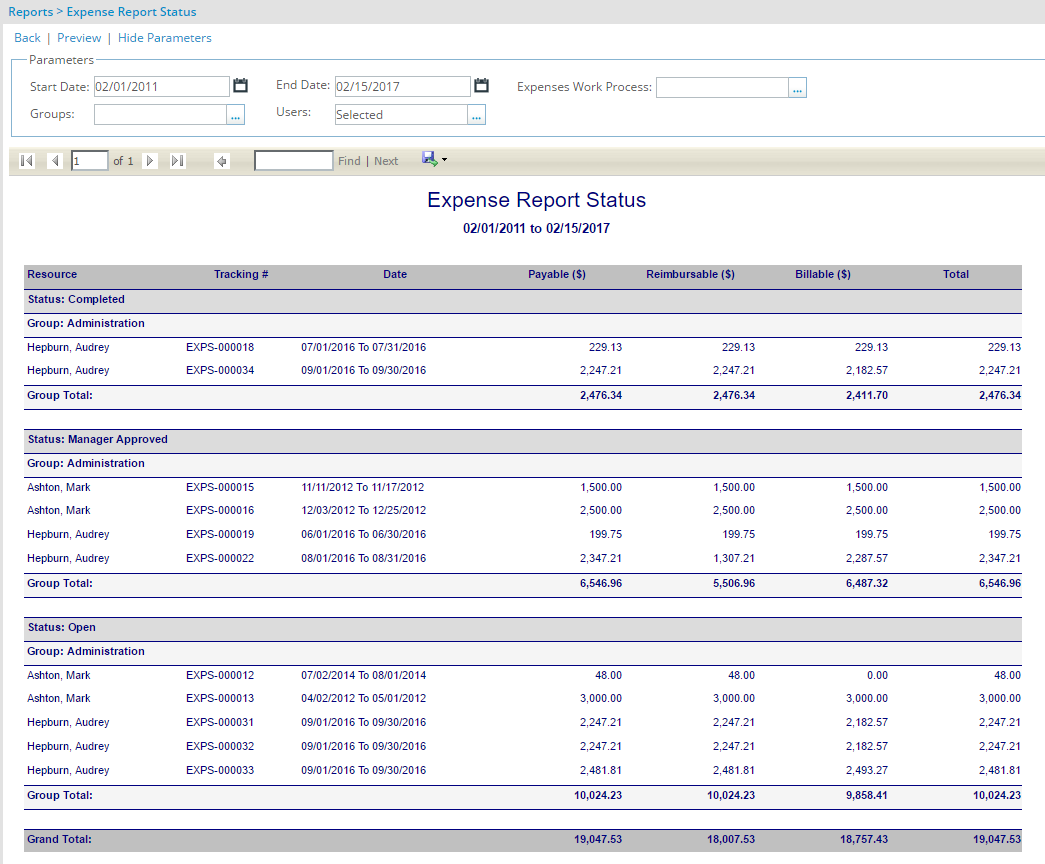
- The Expense Report Status report displays the state of the expense reports by state, resource group and resource, as well as group and grand totals. The Expense Report Status displays the tracking number, date, payable amount, reimbursable amount, billable amount and total amount per resource. To run the Expense Report Status report, specify the date range for the selected expense workflows, resource groups and corresponding resources.
Expense Reports to Approve Report
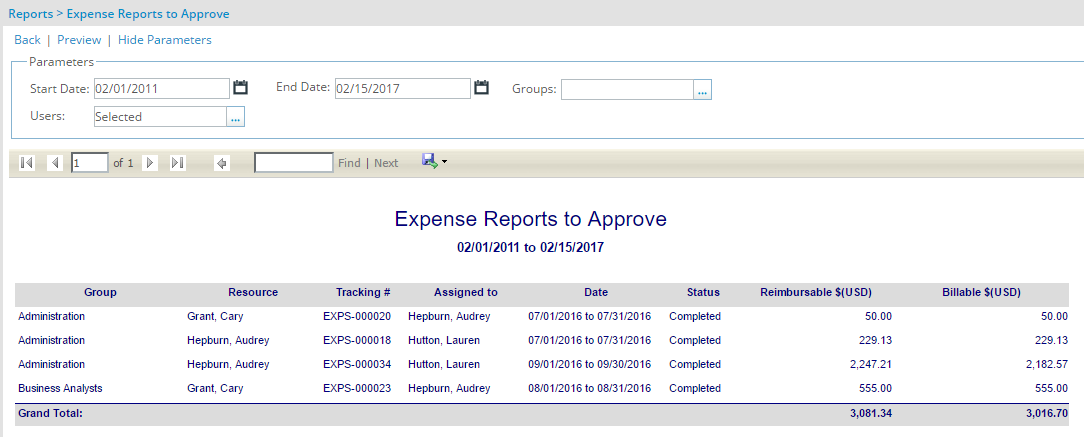
- The Expense Reports to Approve report displays the expense reports having an approval transition from the current state. To run the Expense Reports to Approve report, specify the date range for the selected groups and corresponding resources.
Expenses by Category Report
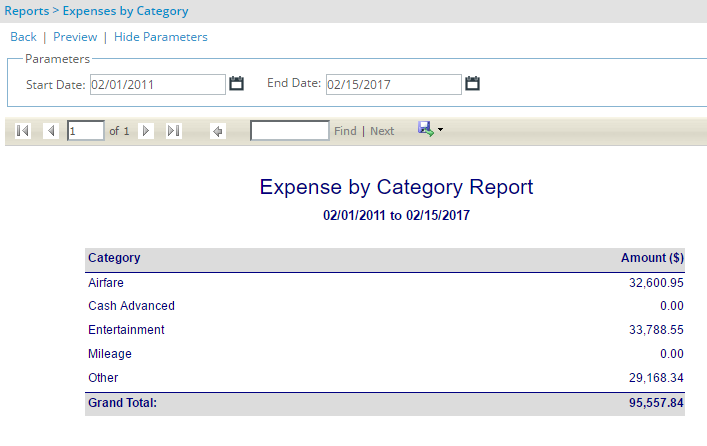
- The Expenses by Category Report displays the total expense amount by expense category. To run the Expenses by Category Report, specify the date range.
Expenses by Client Report
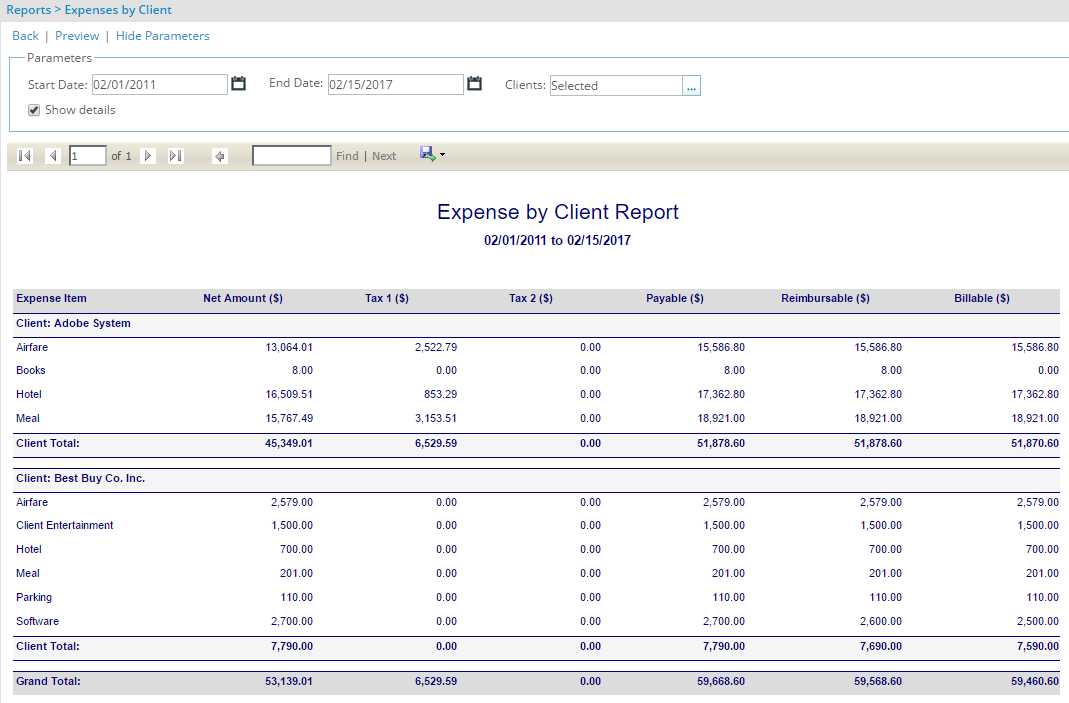
- The Expenses by Client Report displays by client, the net amount, taxes, payable amount, reimbursable amount and billable amount per expense item, as well as client and grand totals. To run the Expenses by Client Report, specify the date range for the selected clients. The Expenses by Client Report also displays the report by client and expense category when the Show details check box is selected.
Expenses by Group Report
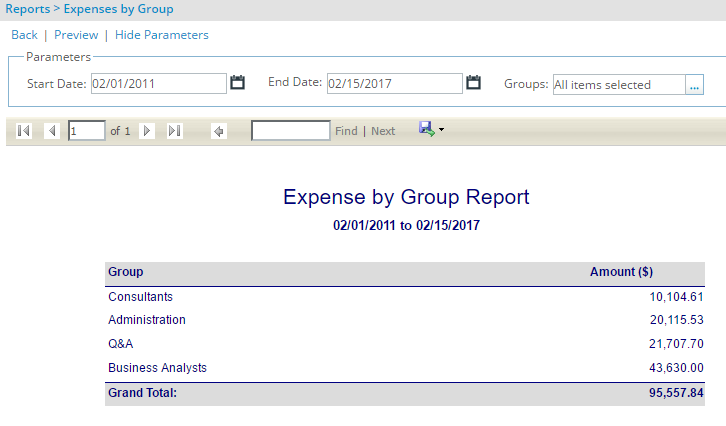
- The Expense by Group Report displays the total expense amount by resource group, as well as the grand total. To run the Expense by Group Report, specify the date range for the selected resource groups.
Expenses by Project Report
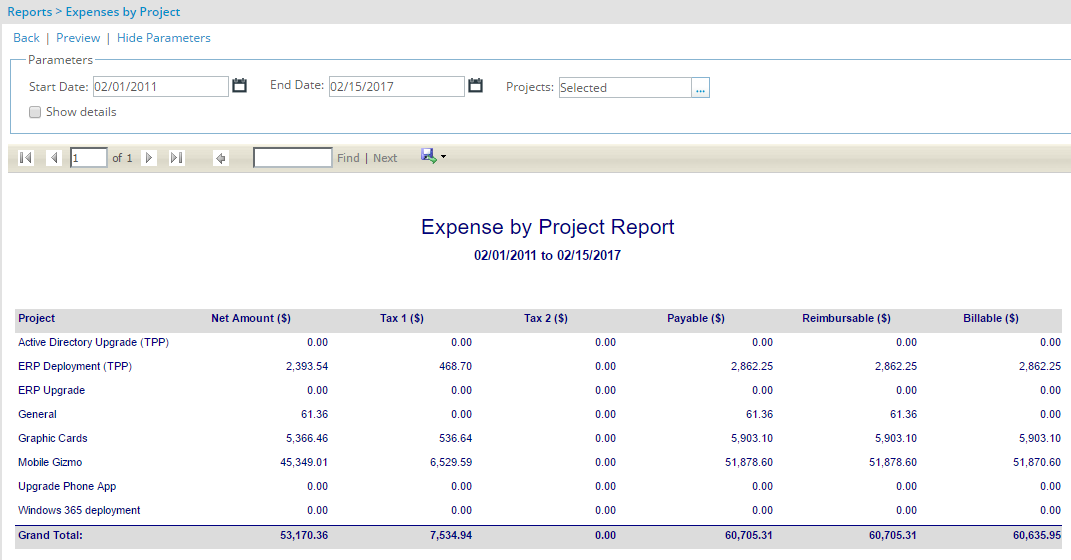
- The Expenses by Project Report displays by project, the net amount, taxes, payable amount, reimbursable amount and billable amount per expense item, as well as the project and grand totals. To run the Expenses by Project Report, specify the date range for the selected projects. The Expenses by Project Report also displays the report by project and expense category when the Show details check box is selected.
Expenses by Resource Report
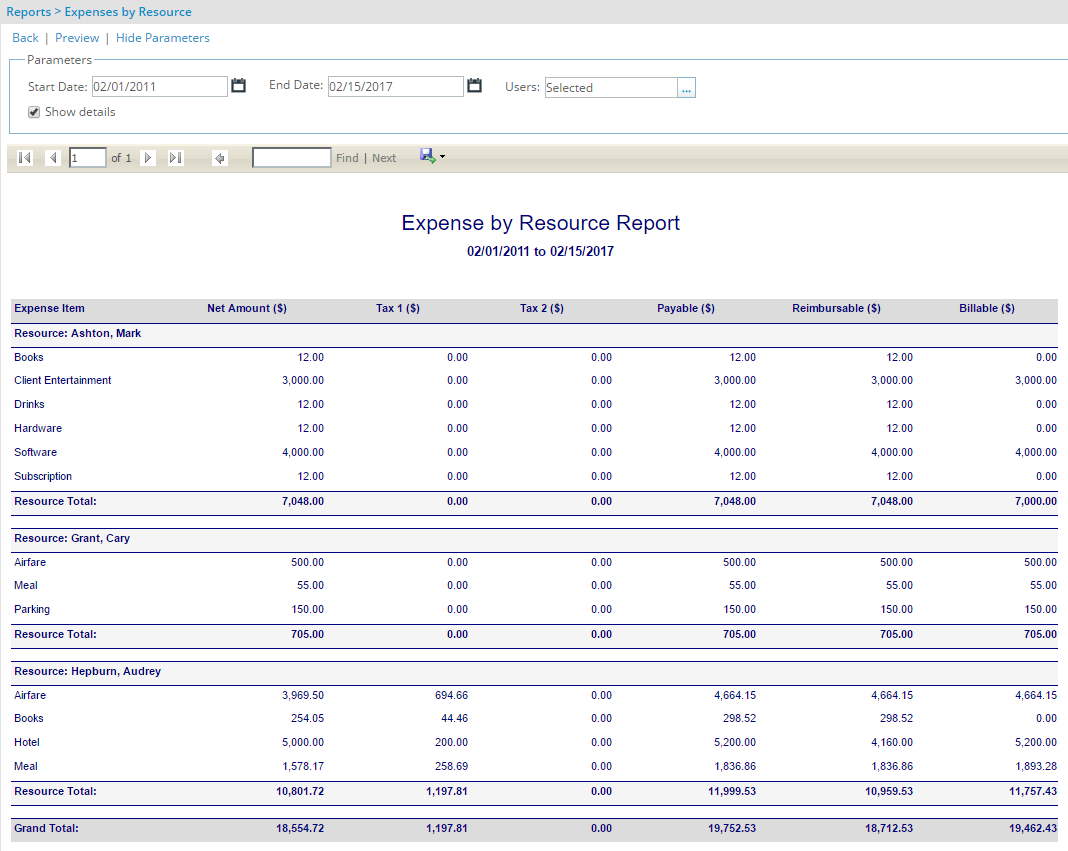
- The Expense by Resource Report displays by resource, the net amount, taxes, payable amount, reimbursable amount and billable amount per expense item, as well as the resource and grand totals. To run the Expenses by Resource Report, specify the date range for the selected resources. The Expenses by Resource Report also displays the report by resource and expense category when the Show details check box is selected.
Itemized Expenses Report
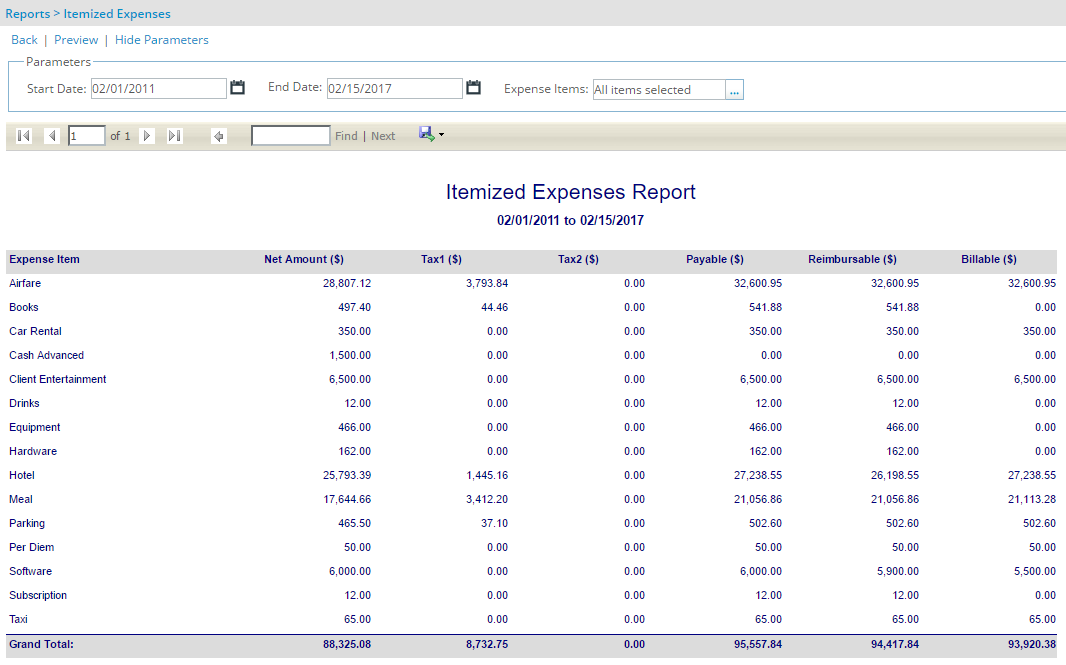
- The Itemized Expenses Report displays the net amount, taxes, payable amount, reimbursable amount and billable amount by expense item. To run the Itemized Expenses Report, specify the date range for the selected expense items.
Late Expense Report
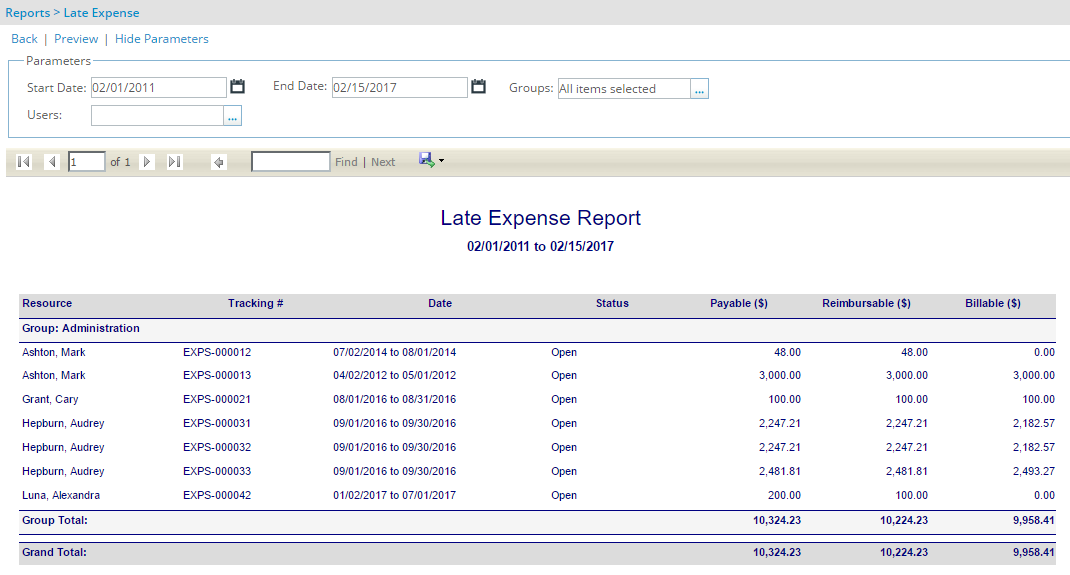
- The Late Expense Report displays the list of open expense reports by resource group and corresponding resources, as well as the group and grand totals. The Late Expense Report displays the tracking number, date, status, payable amount, reimbursable amount and billable amount per resource. To run the Late Expenses Report, specify the date range for the selected resource groups and corresponding resources.
Financial Folder
The Financial folder contains the following reports:
- Accounts Receivable Batch Detailed Transactions Report
- Accounts Receivable Batch Summary Transactions Report
- Client Financial Report
- Project Financial Detailed by Resource Report
- Project Financial Detailed by Task Report
Accounts Receivable Batch Detailed Transactions Report
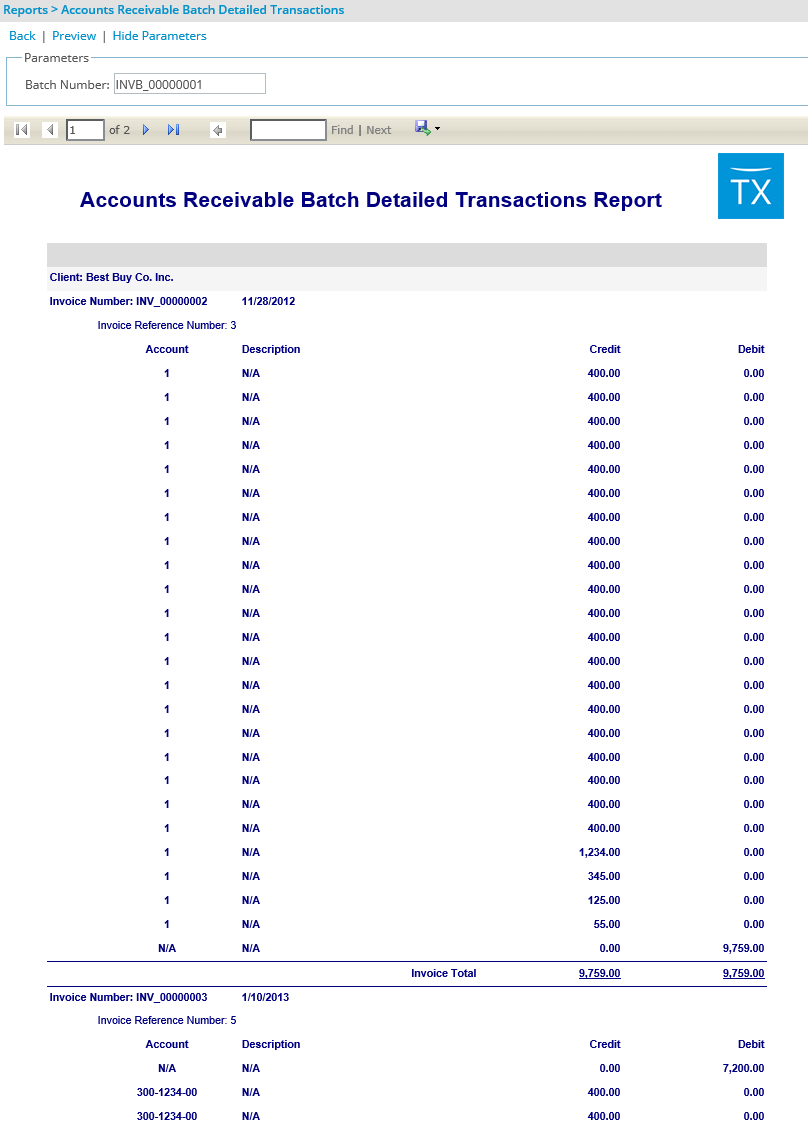
- The Accounts Receivable Batch Detailed Transactions Report displays each credit and debit transaction per account by client, as well as the invoice and client totals. To run an Accounts Receivable Batch Detailed Transactions Report, specify the invoice batch number.
Accounts Receivable Batch Summary Transactions Report
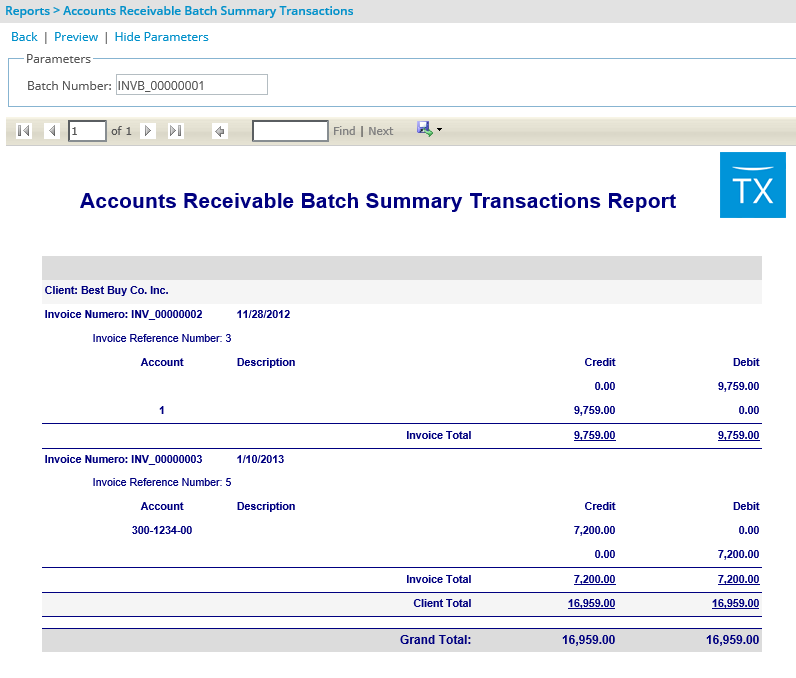
- The Accounts Receivable Batch Summary Transactions Report displays the total credit and debit transaction per account by client. To run the Accounts Receivable Batch Summary Transactions Report, specify the invoice batch number.
Client Financial Report
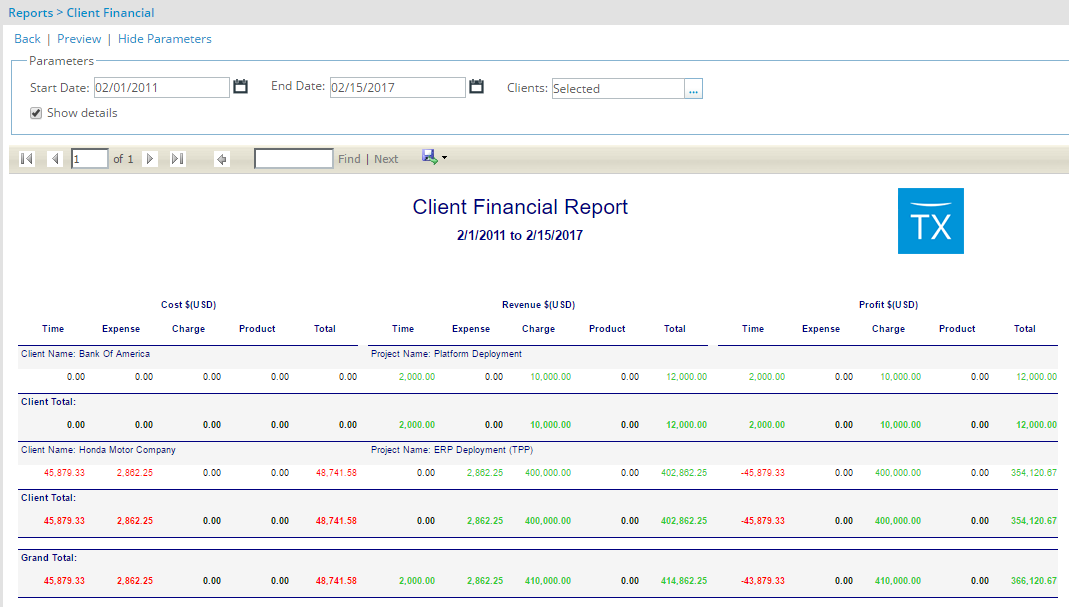
The Client Financial Report displays the time, expense, charge and product totals by cost, revenue and profit by client, as well as the client and grand totals. To run Client Financial Report, specify the date range for the selected clients. The Client Financial Report also displays for each selected client, the totals for the time cost, expense cost, charge cost, product cost, time revenue, expense revenue, charge revenue, product revenue, time profit, expense profit, charge profit and product profit by project when the Show details check box is selected
- Cost, revenue and profit values equal to 0 will are displayed in black font
- Cost values greater than 0 are displayed in red font
- Cost values less than 0 are displayed in green font
- Revenue and profit values greater than 0 are displayed in green font
- Revenue and profit values less than 0 are displayed in red font
Version note: Available as of Tenrox 2011 R1, the time margin, expense margin, charge margin and product margin parameters are renamed time profit, expense profit, charge profit and product profit.
Project Financial Detailed by Resource Report
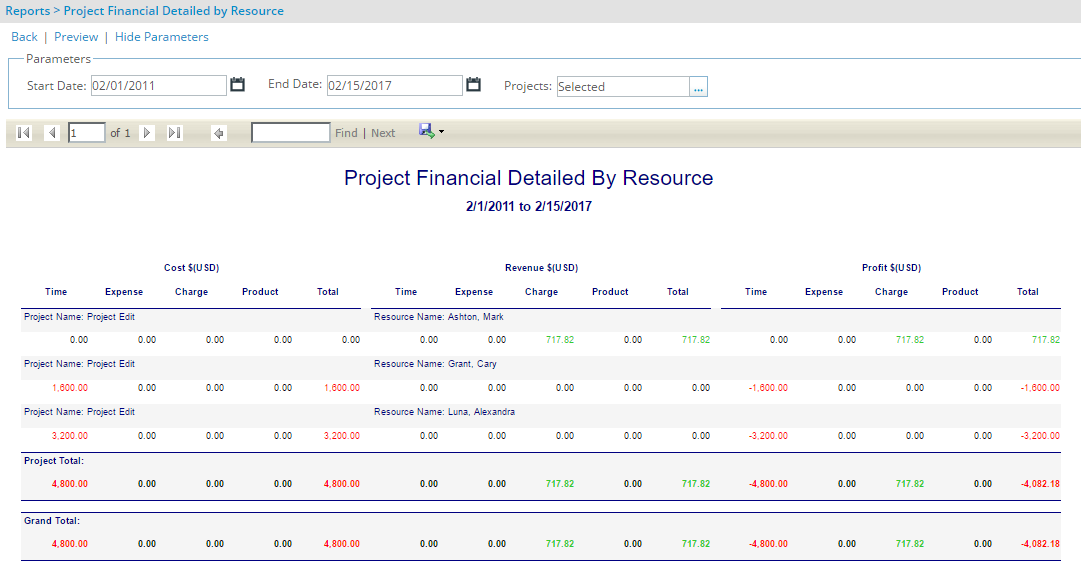
The Project Financial Detailed by Resource report is added to the Financial folder. The Project Financial Detailed by Resource report displays by project, the time, expense, charge and product totals by cost, revenue and profit per resource, as well as the project and grand totals. To run the Project Financial Detailed by Resource report, specify the date range for the selected projects.
- Cost, revenue and profit values equal to 0 are displayed in black font
- Cost values greater than 0 are displayed in red font
- Cost values less than 0 are displayed in green font
- Revenue and profit values greater than 0 are displayed in green font
- Revenue and profit values less than 0 are displayed in red font
Version note: Available as of Tenrox 2011 R1
Project Financial Detailed by Task Report
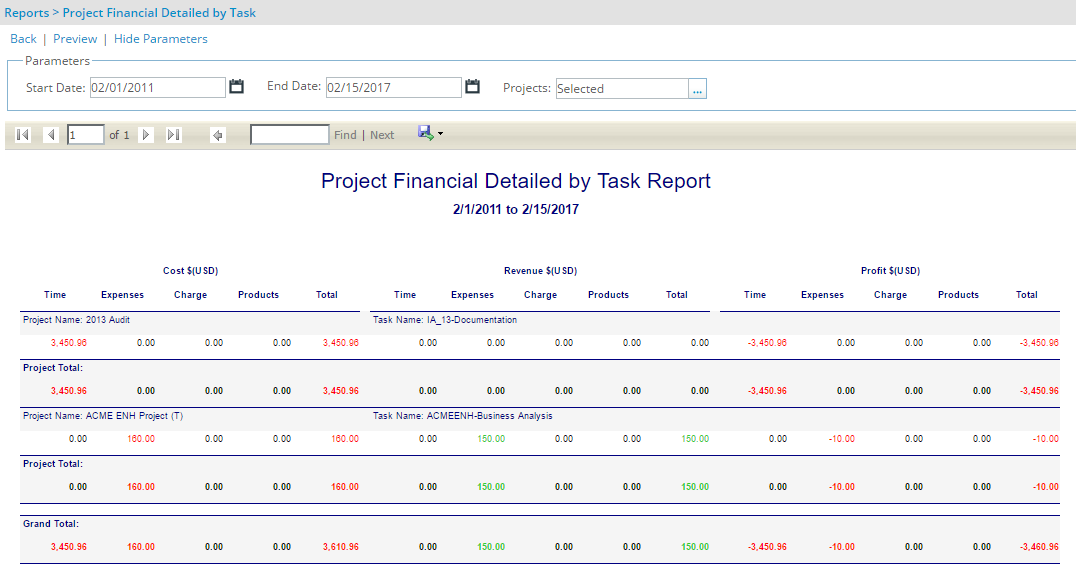
The Project Financial Detailed by Task Report is added to the Financial folder. The Project Financial Detailed by Task Report is grouped by project and displays for each project task, the time, expense, charge and product totals by cost, revenue and profit, as well as the project and grand totals. To run the Project Financial Detailed by Task Report, specify the date range for the selected projects.
- Cost, revenue and profit values equal to 0 are displayed in black font
- Cost values greater than 0 are displayed in red font
- Cost values less than 0 are displayed in green font
- Revenue and profit values greater than 0 are displayed in green font
- Revenue and profit values less than 0 are displayed in red font.
Version note: Available as of Tenrox 2011 R1
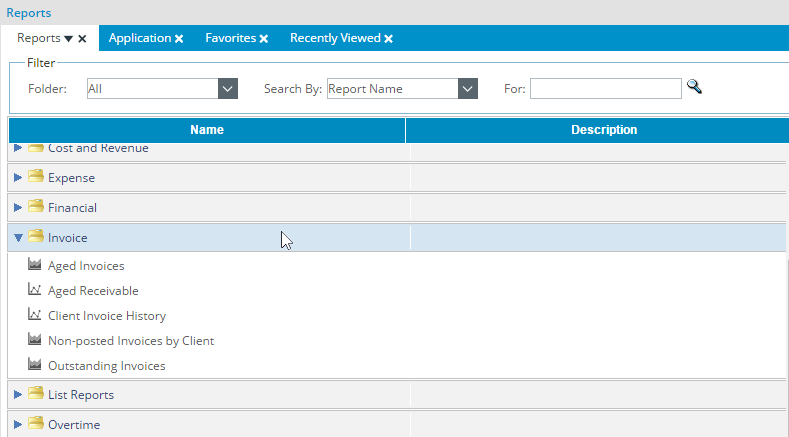
Invoice Folder
The Invoice folder contains the following reports:
- Aged Receivable Report
- Client Invoice History Report
Aged Receivable Report
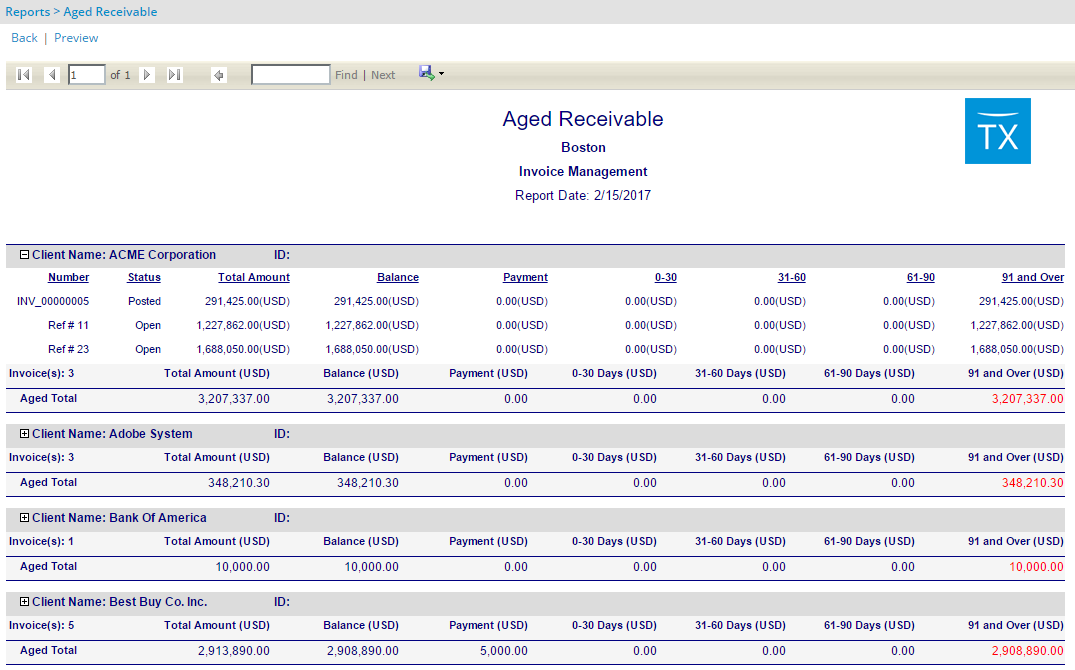
- The Aged Receivable report is grouped by client and displays the client name, ID and number of invoices issued with outstanding balances per client, as well as the grand total. Each client invoice displays the total amount, the balance, the payments, and the 0-30 days, 31-60 days, 61-90 days, 91 days and over balances, as well as the Aged Total. The Aged Total for the balance is the sum of all outstanding invoice balances for a client that is converted into the client currency.
Client Invoice History Report
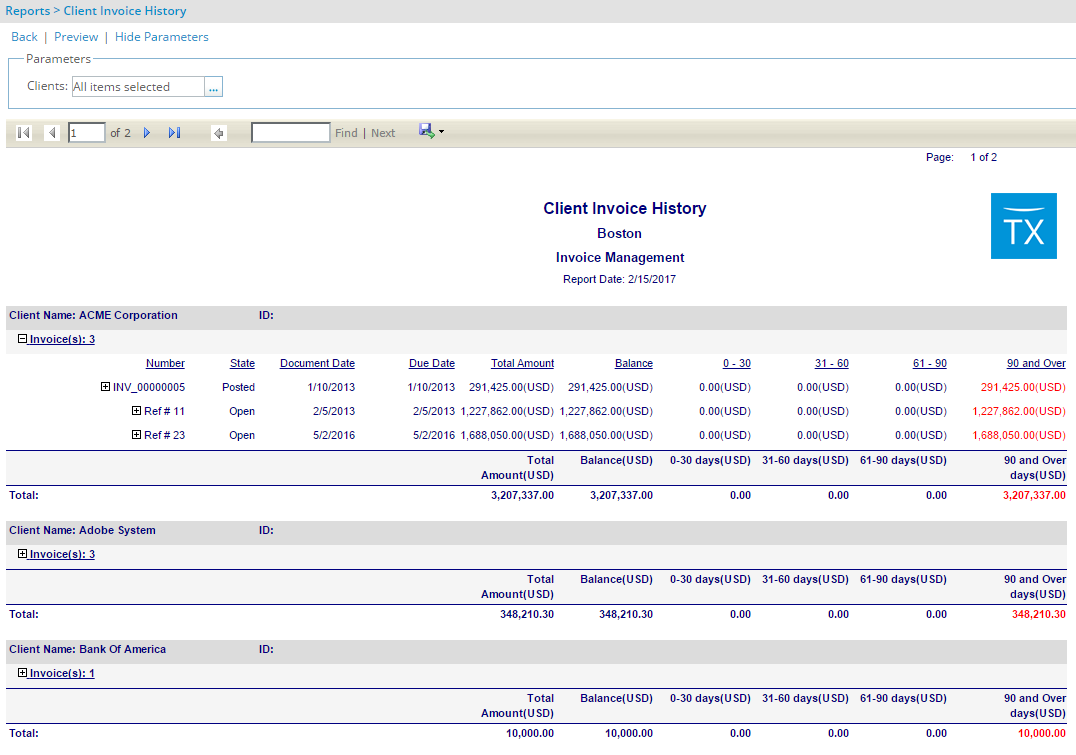
- The Client Invoice History report displays the invoices and payment history of all selected clients. The Client Invoice History report is grouped by client and displays the client name, ID and number of invoices per client. A summary of all the client invoices with the total amount, balance, 0-30 days, 31-60 days, 61-90 days, 90 days and over, as well the total for each field and grand total for all the clients is also displayed.
List Reports Folder
The List Reports folder contains the following reports:
- Client Phone List Report
- Project List Report
- Resource List Report
Client Phone List Report
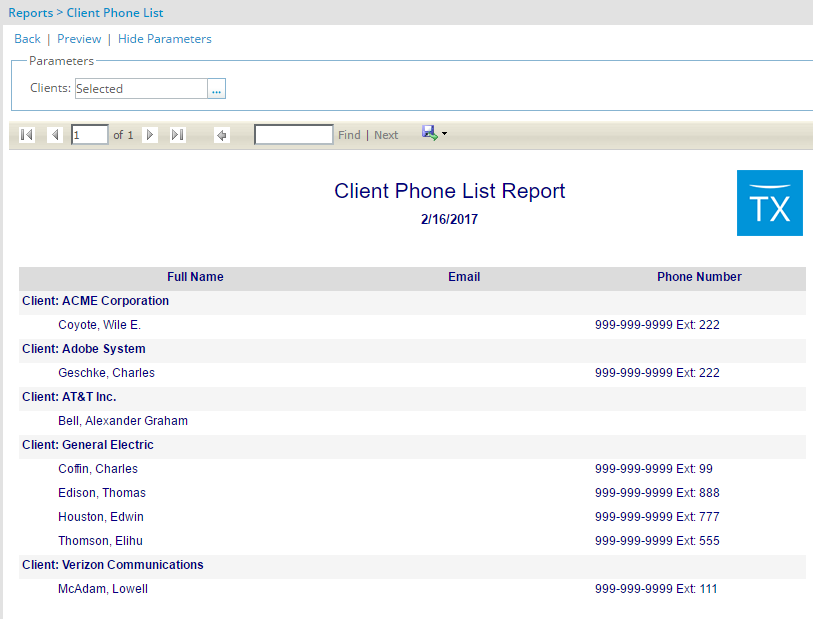
- The Client Phone List Report is grouped by client and displays the name, email and phone number of the contacts for the selected clients.
Project List Report
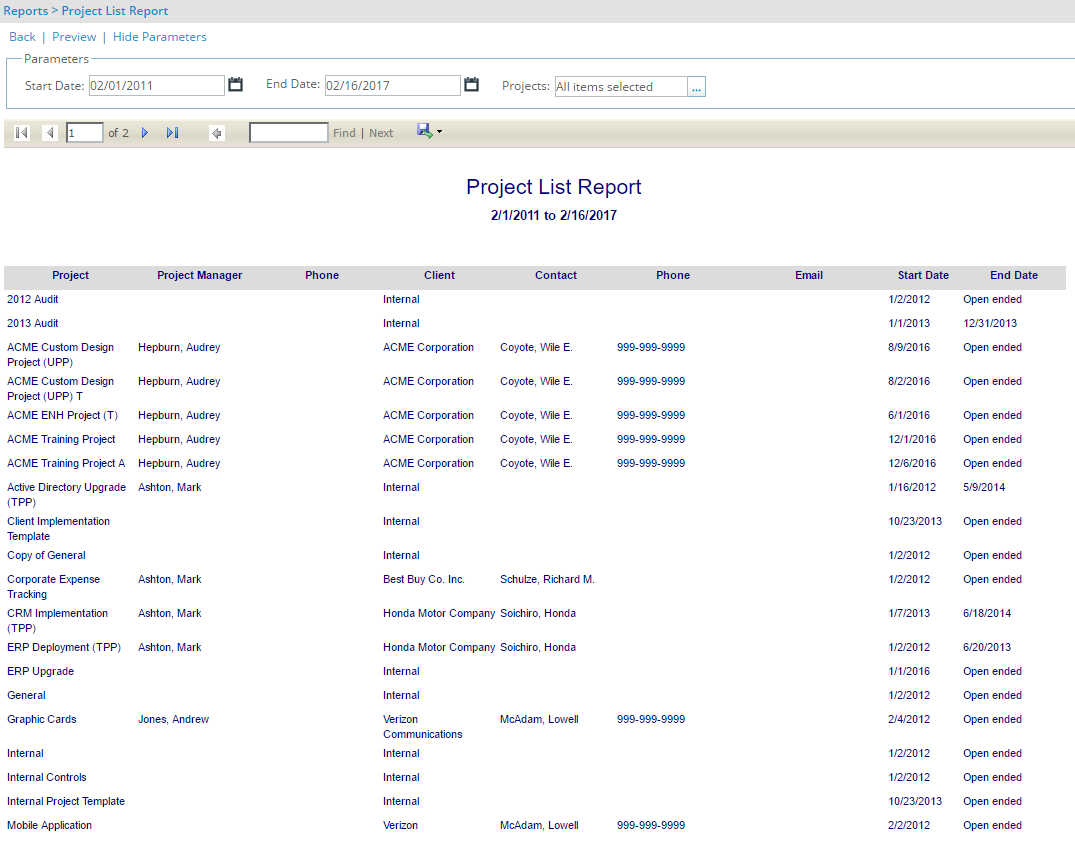
- The Project List Report displays by project, the project name, the Project Manager, the Project Manager's phone number, the client name, the client contact name, client contact's phone number and email, as well as the project's start and end date. To run the Project List Report, specify the date range for the selected projects.
Resource List Report
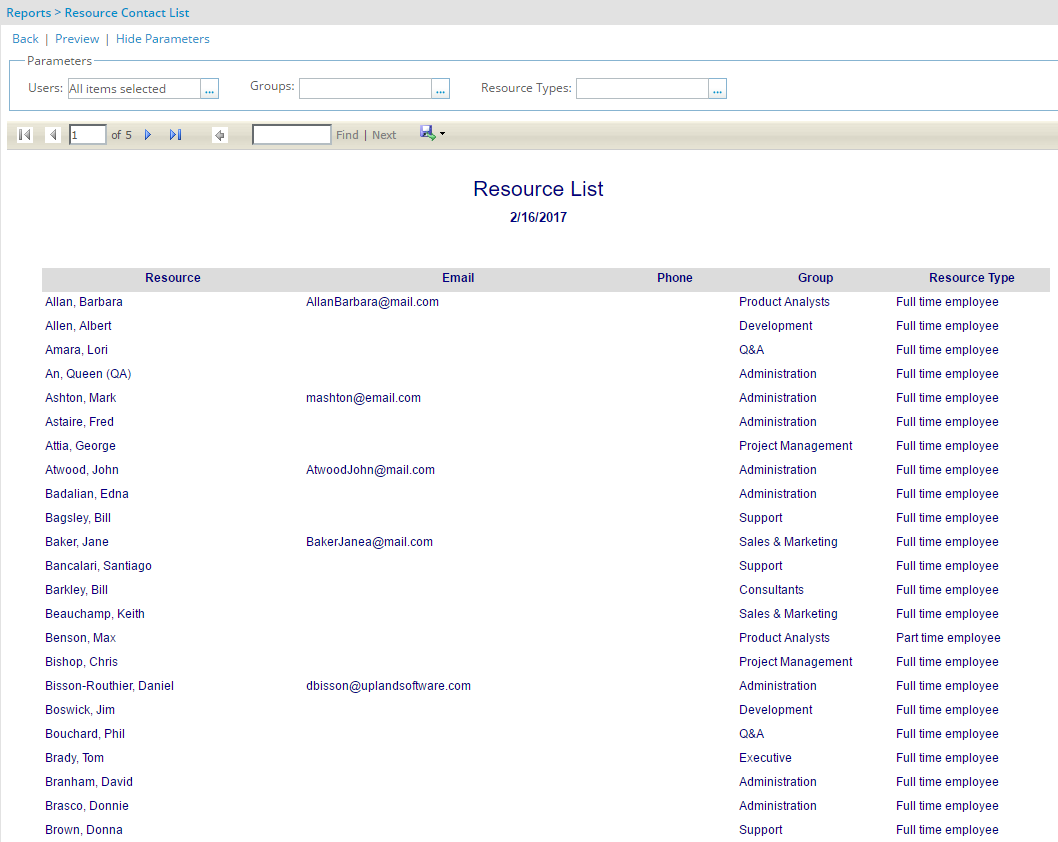
The Resource List report is grouped by user role and displays the name, email, phone number, resource group and resource type per user.
Version note: Available as of Tenrox 2011 R1: The Resource Contact List report is renamed to Resource List report and the Address field is removed from the report.
Overtime Folder
The Overtime folder contains the following reports:
- Project Overtime Detailed by Resource Report
- Project Overtime Detailed by Task Report
- Resource Overtime Report
Project Overtime Detailed by Resource Report
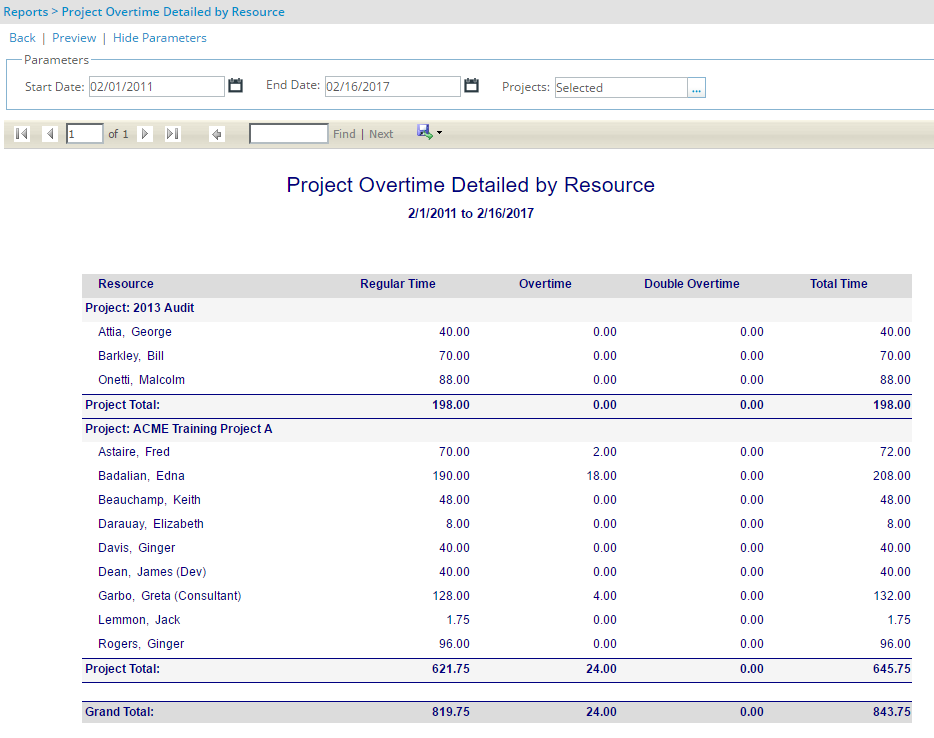
- The Project Overtime Detailed by Resource report displays by project, the regular time, overtime, double overtime and total time per resource, as well as the project and grand totals. To run the Project Overtime Detailed by Resource report, specify the date range for the selected projects.
Project Overtime Detailed by Task Report
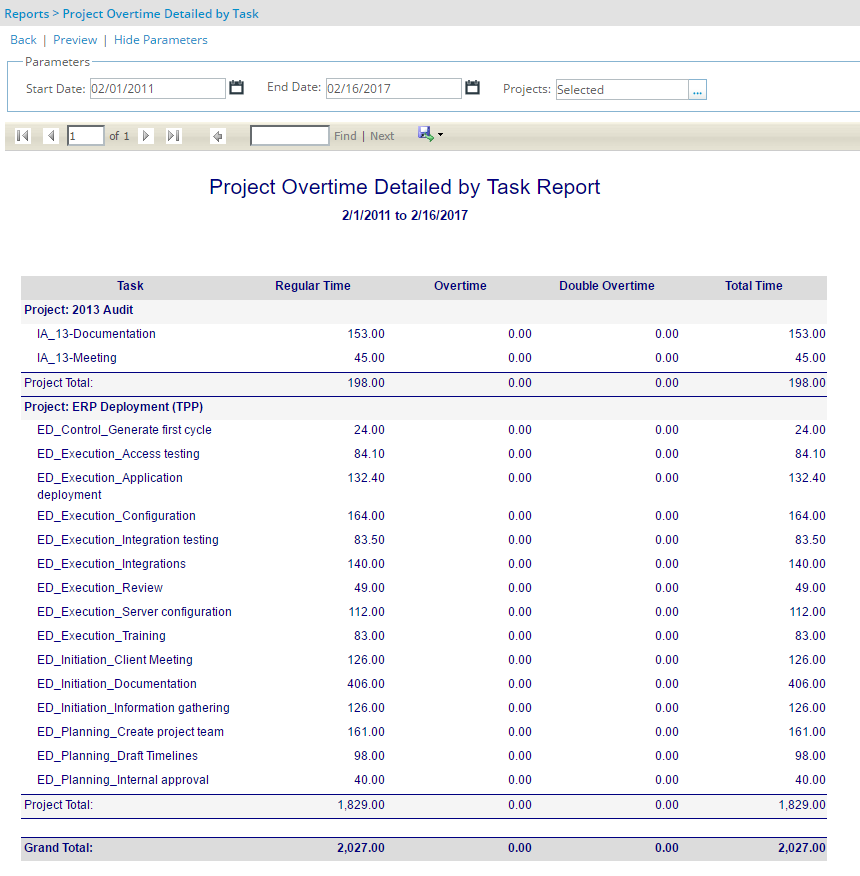
- The Project Overtime Detailed by Task Report is grouped by project and displays for each project task, the regular time, overtime, double overtime and total time, as well as the project and grand totals. To run the Project Overtime Detailed by Task Report, specify the date range for the selected projects.
Resource Overtime Report
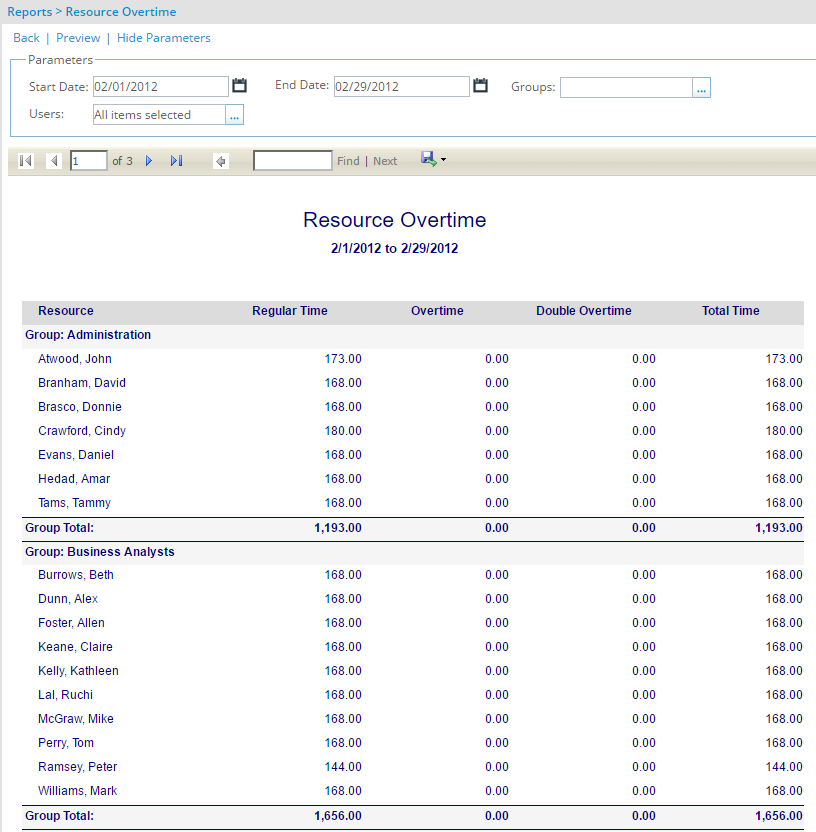
- The Resource Overtime report is grouped by resource group and displays for each resource, the regular time, overtime, double overtime and total time, as well as the group and grand totals. To run the Resource Overtime report, specify the date range for the selected resource groups and corresponding resources.
Portfolio Folder
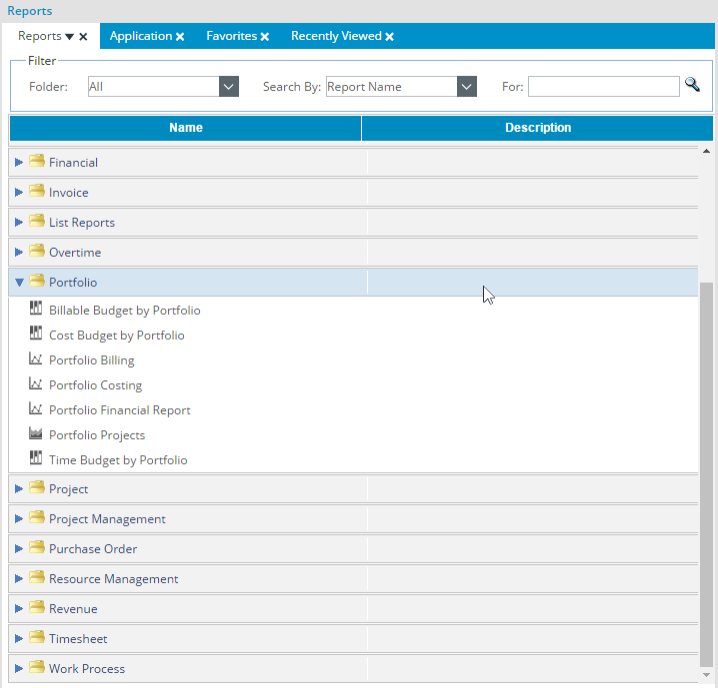
The Portfolio folder contains the following reports:
- Portfolio Billing Report
- Portfolio Cost Report
- Portfolio Financial Report
Note: The Portfolio folder also contains the Billable Budget by Portfolio, Cost Budget by Portfolio and Time Budget by Portfolio OLAP reports as long as OLAP licenses exist.
Portfolio Billing Report
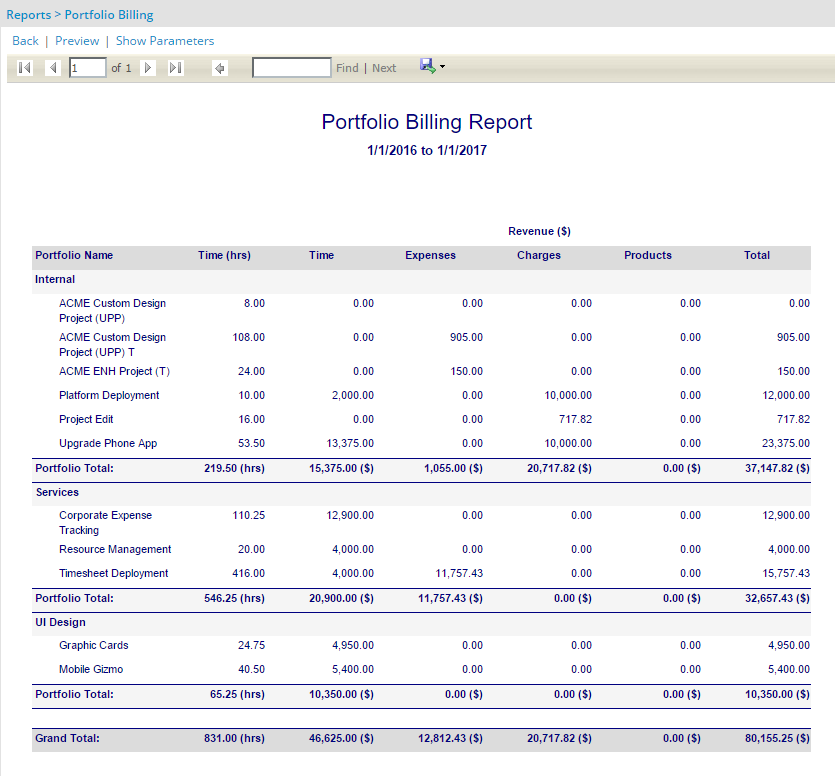
The Portfolio Billing Report displays the time, time amount, expense amount, charge amount, product amount and corresponding total by portfolio. To run the Portfolio Billing Report, specify the date range for the selected portfolios.
The Portfolio Billing Report is grouped by portfolio and also displays for each project, the billable time, the billable time amount, the billable expense amount, the billable charge amount, the billable product amount and corresponding total billable amount when the Detailed by Project check box is selected. If the Detailed by Project check box is not selected, the report displays for each portfolio, the billable time, the billable time amount, the billable expense amount, the billable charge amount, the billable product amount and the total billable amount.
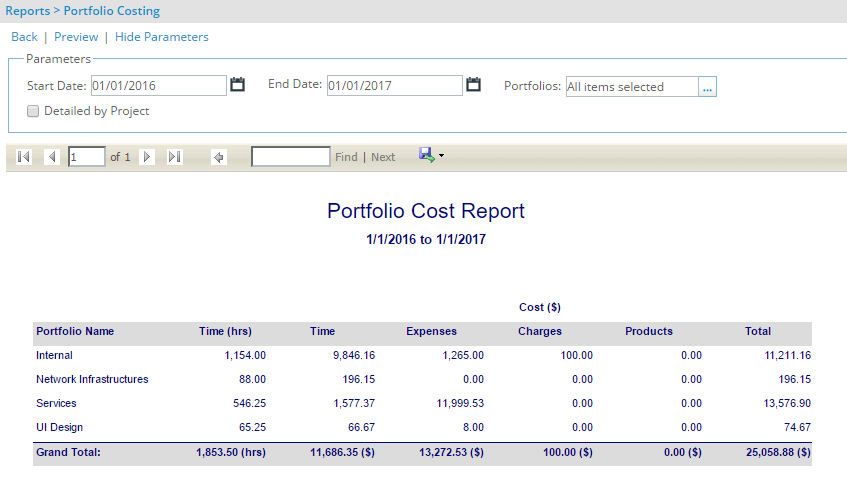
Portfolio Cost Report
The Portfolio Cost Report displays the time, time amount, expense amount, charge amount, product amount and corresponding total by portfolio. To run the Portfolio Billing Report, specify the date range for the selected portfolios.
The Portfolio Cost Report is grouped by portfolio and also displays for each project, payable time, the payable time amount, the payable expense amount, the payable charge amount, the payable product amount and the total payable amount and corresponding total payable amount when the Detailed by Project check box is selected. If the Detailed by Project check box is not selected, the report displays for each portfolio, the payable time, the payable time amount, the payable expense amount, the payable charge amount, the payable product amount and the total payable amount.
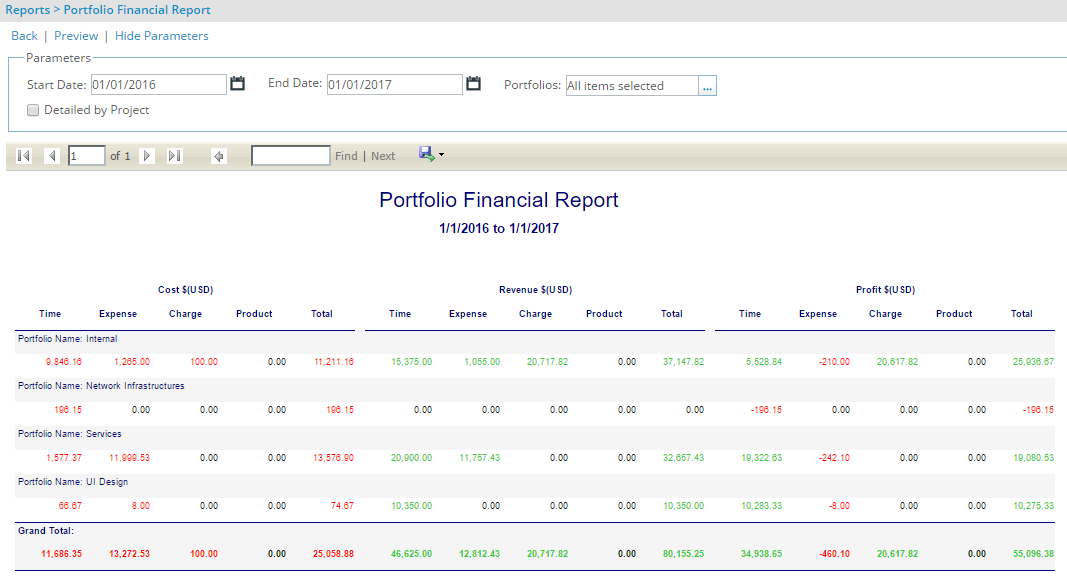
Portfolio Financial Report
The Portfolio Financial Report displays by portfolio, the time, expense, charge and product totals by cost, revenue and profit, as well as the portfolio and grand totals. To run the Portfolio Financial Report, specify the date range for the selected portfolios.
The Portfolio Financial Report is grouped by portfolio and also displays for each project, the cost amount of time, expense amount, charge amount, product amount, the revenue amount of time, expense amount, charge amount, product amount, profit for time amount, expense amount, charge amount, product amount and corresponding total amounts when the Detailed by Project check box is selected. If the Detailed by Project check box is not selected, the report displays for each portfolio, the cost amount of time, expense amount, charge amount and product amount, the revenue amount of time, expense amount, charge amount and product amount, the profit for time amount, expense amount, charge amount, product amount and corresponding total amounts.
- Cost, revenue and profit values equal to 0 are displayed in black font
- Cost values greater than 0 are displayed in red font
- Cost values less than 0 are displayed in green font
- Revenue and profit values greater than 0 are displayed in green font
- Revenue and profit values less than 0 are displayed in red font
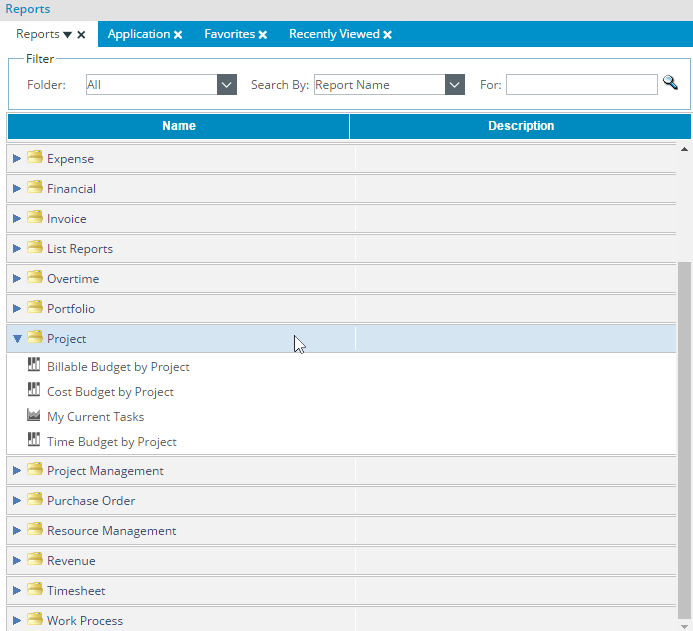
Project Folder
The Project folder is available only when the OLAP licenses exist. The Project folder contains the following OLAP reports:
- Billable Budget by Project Report
- Cost Budget by Project Report
- Time Budget by Project Report
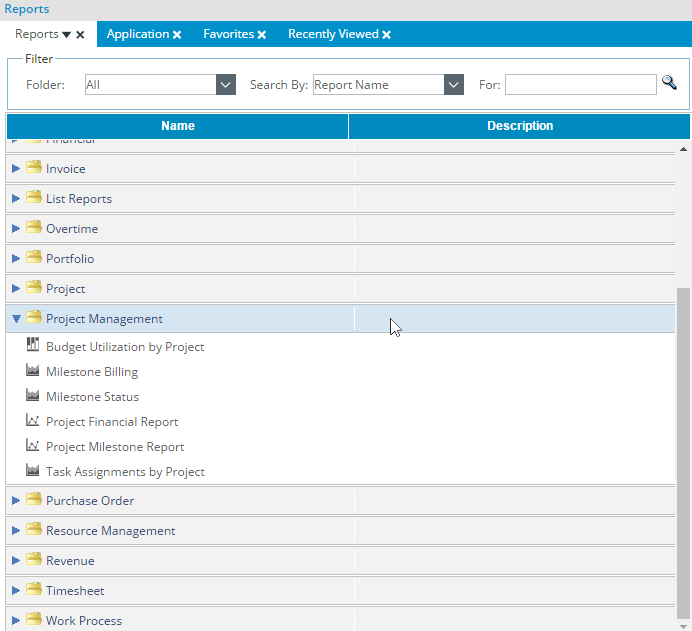
Project Management Folder
The Project Management folder contains the following reports:
- Project Financial Report
- Project Milestone Report
- Project PO Report
Project Financial Report
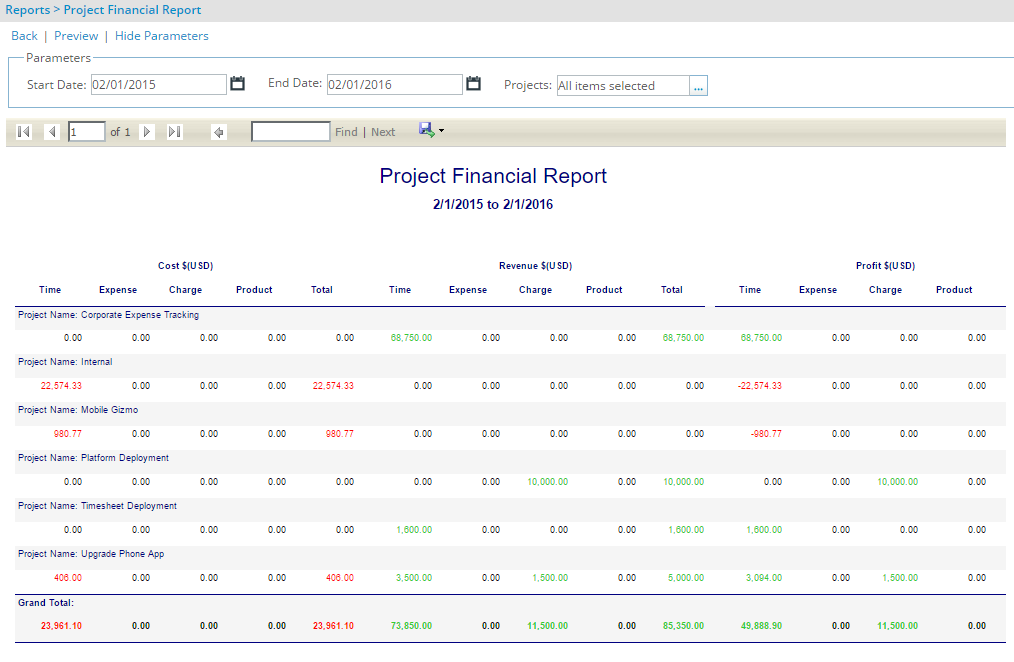
The Project Financial Report displays for each project, the cost amount of time, expense amount, charge amount, product amount, the revenue amount of time, expense amount, charge amount, product amount, profit for time amount, expense amount, charge amount, product amount and corresponding total amounts, as well as the project and grand totals. To run the Project Financial Report, specify the date range for the selected projects.
- Cost, revenue and profit values equal to 0 are displayed in black font
- Cost values greater than 0 will be displayed in red font
- Cost values less than 0 are displayed in green font
- Revenue and profit values greater than 0 are displayed in green font
- Revenue and profit values less than 0 are displayed in red font
Project Milestone Report
Version note: Available as of Tenrox 2011 R1
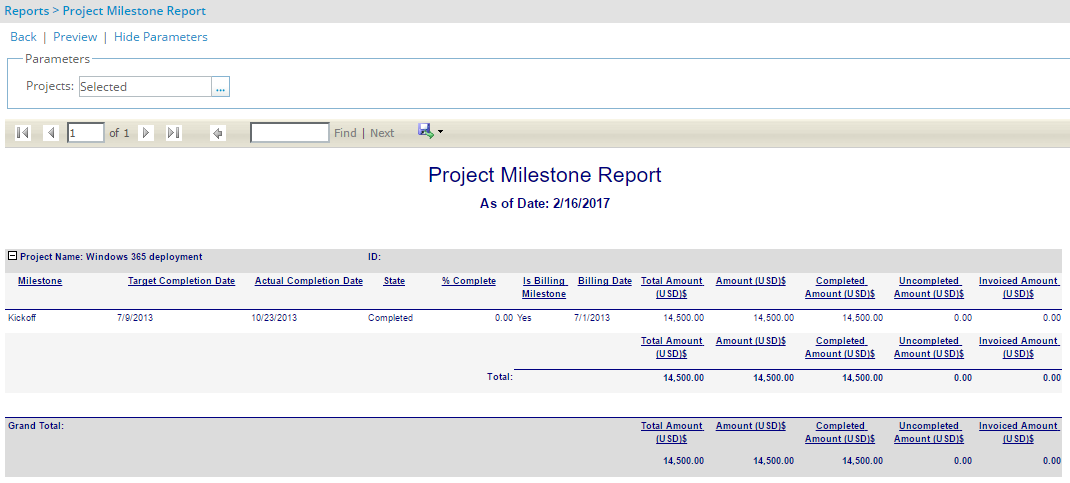
The Project Milestone Report displays a list of milestones associated to the selected projects and their corresponding details and billing information, as well as the project and grand totals. The Project Milestone Report is grouped by project and displays the project name and ID. The Project Milestone Report displays a list of milestones per project with the following information:
- Milestone: name of the milestone; if a milestone has a a sub-milestone billing rule, it is indented under the parent
- Target Completion Date: target completion date defined for the milestone
- Actual Completion Date: actual completion date of the milestone; If a milestone is not yet completed, this field is empty
- State: state of the milestone
- % Complete: percent complete defined for the milestone
- Is Billing Milestone: defines whether a milestone is used for billing or not; Yes is displayed if the Is Billing check box is selected for the milestone (Setup>Work>Projects>Project Edit>Milestone Edit), otherwise No is displayed
- Billing Date: billing date defined for the milestone billing rule; if a milestone is not associated to a billing rule or is not a billing milestone, this field is empty
- Amount: amount of the milestone billing rule displayed in the base currency using the exchange rate of the current date; set to 0 for non-billable milestones and billable milestones not associated to a billing rule
- Completed Amount: completed amount of the milestone billing rule displayed in the base currency using the exchange rate of the current date; set to 0 for non-billable milestones, billable milestones not associated to a billing rule or billable milestones associated to a billing rule but not in the completed state
- Uncompleted Amount: uncompleted amount of the milestone billing rule displayed in the base currency using the exchange rate of the current date; set to 0 for non-billable milestones, billable milestones not associated to a billing rule or billable milestones associated to a billing rule but not in the completed state
- Invoiced Amount: amount of the milestone invoiced displayed in the base currency using the exchange rate of the current date; set to 0 for non-invoiced milestones
Project PO Report
Version note: Available as of Tenrox 2011 R1
The Project PO Report is added to the Project Management folder. The Project PO Report display the Purchase Order (PO) details for per project. The Project PO Report displays by project, a list of project POs and their details, such as PO name, reference number, expiry date, total amount of the PO, amount consumed from the PO associated to an invoice, amount remaining for the PO (PO Amount – PO Consumed Amount), invoice number in which the PO is included and the invoiced amount of the PO in the system currency. The Project PO Report also displays the invoices in which each PO is included with its details.
Note: The total, consumed and remaining amounts are displayed in the base currency.
To run the Project PO Report, specify the date range for the selected projects and corresponding clients. The Project PO Report is grouped by project and display the following per project:
- Project Name: name of the project
- Project Id: identification of the project
- Manager: project manager assigned to the project
- Client Name: name of the client associated with the project
Purchase Order Folder
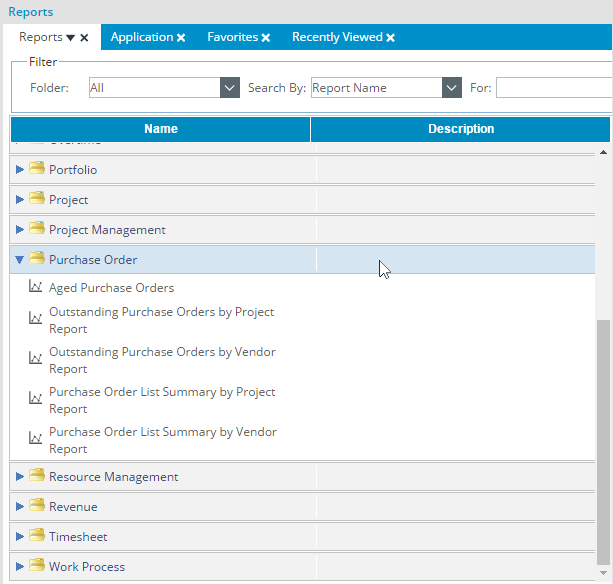
The Purchase Order folder contains the following reports:
- Aged Purchase Orders Report
- Outstanding Purchase Orders by Project Report
- Outstanding Purchase Orders by Vendor Report
- Purchase Order List Summary by Project Report
- Purchase Order List Summary by Vendor Report
Aged Purchase Orders Report
- The Aged Purchase Orders Report displays all Purchase Orders (POs) where the current date is <x> days before the due date. The report displays the PO number, date required and created, originator, project, priority, state and amount. To run the Aged Purchase Orders Report, specify the date range and the number of days the POs are required before the due date. The Aged Purchase Orders Report also sorts the results by priority when the Order by priority check box is selected.
Outstanding Purchase Orders by Project Report
- The Outstanding Purchase Orders by Project Report displays all Purchase Orders (POs) not in an open state by project. The Outstanding Purchase Orders by Project Report displays the PO number, required and created date, originator, project, priority, state and amount. To run the Outstanding Purchase Orders by Project Report, specify the date range for the selected projects. The Outstanding Purchase Orders by Project Report also sorts the results by priority when the Order by priority check box is selected.
Outstanding Purchase Orders by Vendor Report
- The Outstanding Purchase Orders by Vendor Report displays all Purchase Orders (POs) not in an open state by vendor. The report displays the PO number, required and created date, originator, project, priority, state and amount. To run the Outstanding Purchase Orders by Vendor Report, specify the date range for the selected vendors. The Outstanding Purchase Orders by Vendor Report also sorts the results by priority when the Order by priority check box is selected.
Purchase Order List Summary by Project Report
- The Purchase Order List Summary by Project Report displays all Purchase Orders (POs) by project. The Purchase Order List Summary by Project Report displays the PO number, required and created date, originator, project, priority, state and amount. To run the Purchase Order List Summary by Project Report, specify the date range for the selected projects. The Purchase Order List Summary by Project Report also sorts the results by priority when the Order by priority check box is selected.
Purchase Order List Summary by Vendor Report
- The Purchase Order List Summary by Vendor Report displays all Purchase Orders (POs) by vendor. The Purchase Order List Summary by Vendor Report displays the PO number, required and created date, originator, project, priority, state and amount. To run the Purchase Order List Summary by Vendor Report, specify the date range for the selected vendors. The Purchase Order List Summary by Vendor Report also sorts the results by priority when the Order by priority check box is selected.
Resource Management Folder
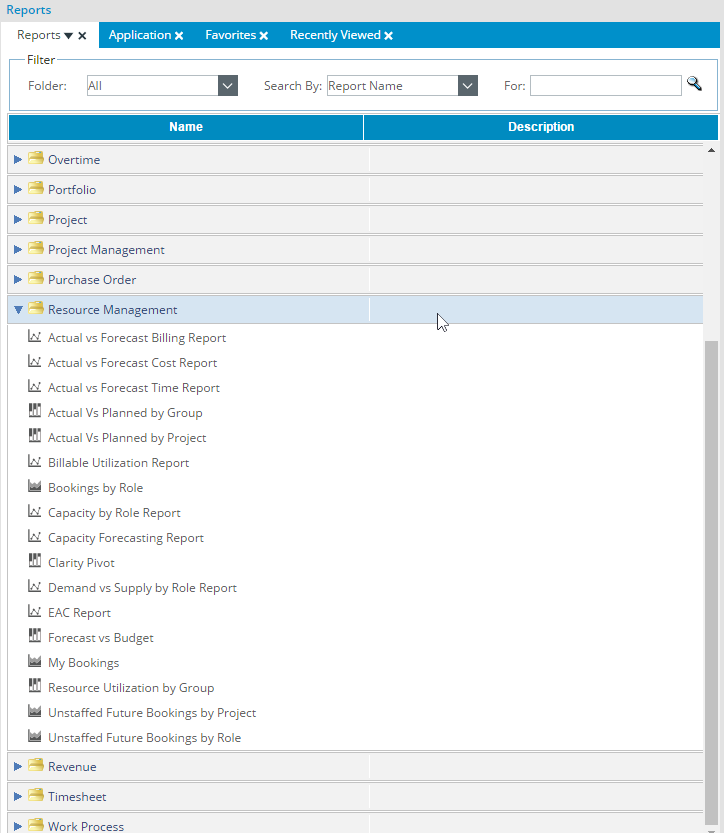
The Resource Management folder contains the Capacity Forecasting Report. The Resource Management folder also contains the following OLAP reports as long as OLAP licenses exist:
- Actual Vs Planned by Group
- Actual Vs Planned by Project
- Resource Utilization by Group
- Skill Inventory Report
Capacity Forecasting Report
Available as of: Tenrox 2011 R3
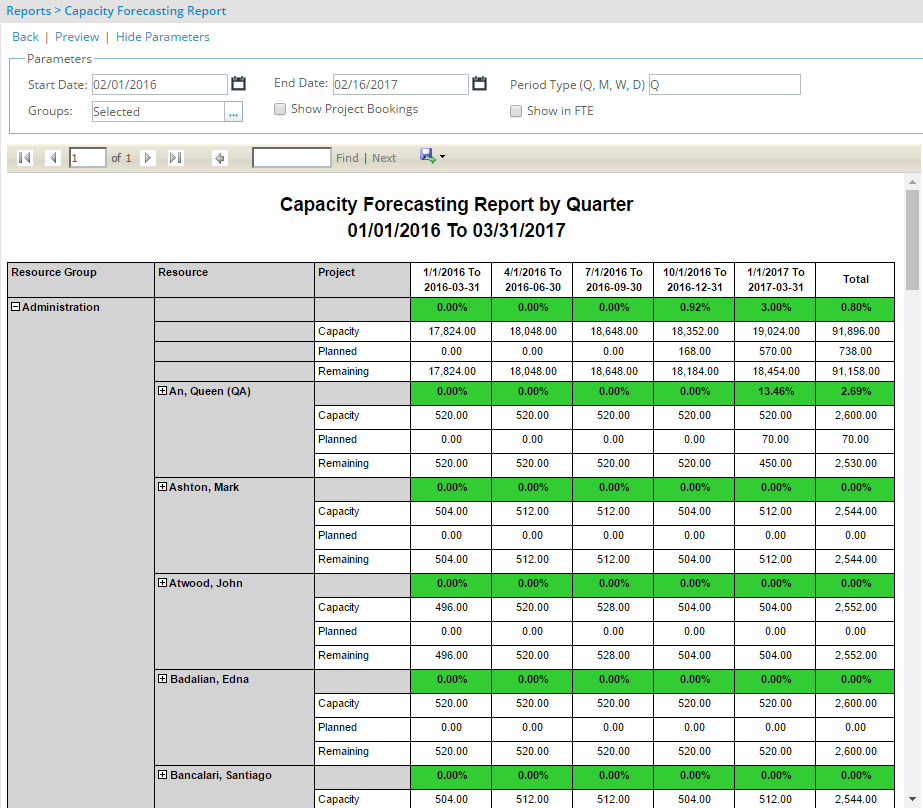
The Forecasting by Resource Group Report displays the Total Capacity, Planned Work and Remaining Capacity, by
the Period Type indicated, within a specified date range, for the selected resource group(s) and for each of the
resources under the chosen group(s).
Within the given period, the values that display specifically represent the following:
- The Total Capacity, Planned Work and Remaining Capacity in unit hours for each group and each resource.
- The group's and resource's Utilization percentages, highlighted in color, and calculated as Planned/Total Capacity * 100:
Green: Less than or equal to 80%
Orange: Greater than (>) 80%, and Less than or equal to 100%
Red: Greater than (>) 100%
This report displays seven (7) periods at one time, with the Total column at the very right of the page, representing values for the seven (7) periods.
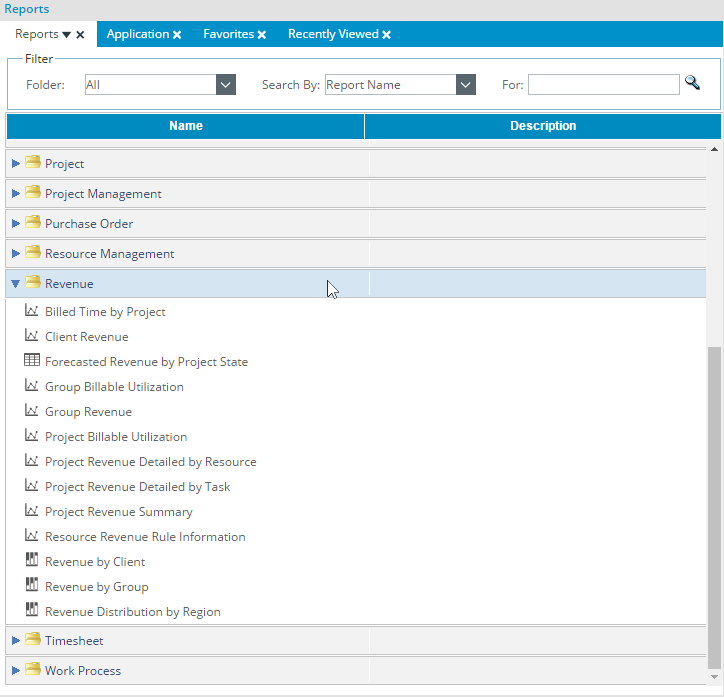
Revenue Folder
The Revenue folder contains the following reports:
- Billed Time by Project Report
- Client Revenue Report
- Group Billable Utilization Report
- Group Revenue Report
- Project Billable Utilization Report
- Project Revenue Detailed by Resource Report
- Project Revenue Detailed by Task Report
- Project Revenue Summary Report
- Resource Revenue Rule Information Report
Note: The Revenue folder also contains the Revenue by Client and Revenue by Group OLAP reports as long as OLAP licenses exist.
Billed Time by Project Report
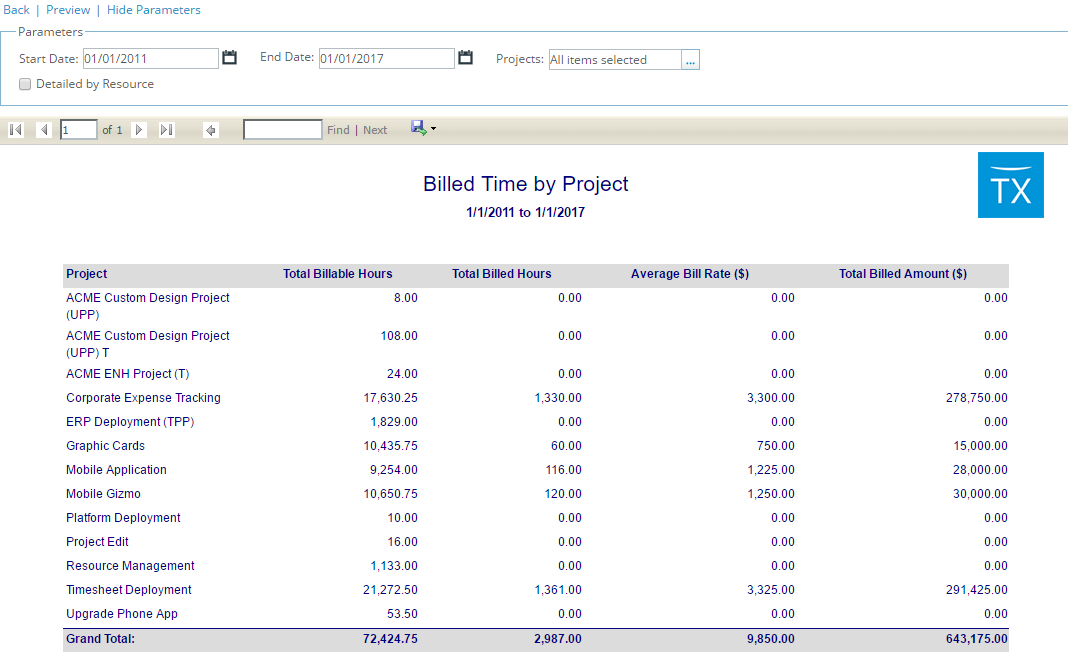
The Billed Time by Project report is grouped by project and displays the total billable hours, total billed hours, average billing rate and total amount, as well as the project totals, for the selected projects. To run the Billed Time by Project report, specify the date range for the selected projects. The Billed Time by Project report is grouped by project and also displays for each resource, the total billable hours, the total billed hours, the average billed rate (Total Billed Amount/Total Billed Hours) and the total billed amount when the Detailed by Resource check box is selected. If the Detailed by Resource check box is not selected, the report displays for each project, the total billable hours, the total billed hours, the average billed rate and the total billed amount.
Available as of: Tenrox 2011 R1, the Detailed by Resource check box and the Total Billable Hours column that displays the total billable hours for the projects and corresponding resources is added to the Billed Time by Project report. Also, the Total hours column is renamed Total Billed Hours, the Bill rate ($) column is renamed Average Bill Rate ($) and the Total amount ($) column is renamed Total Billed Amount ($).
Client Revenue Report
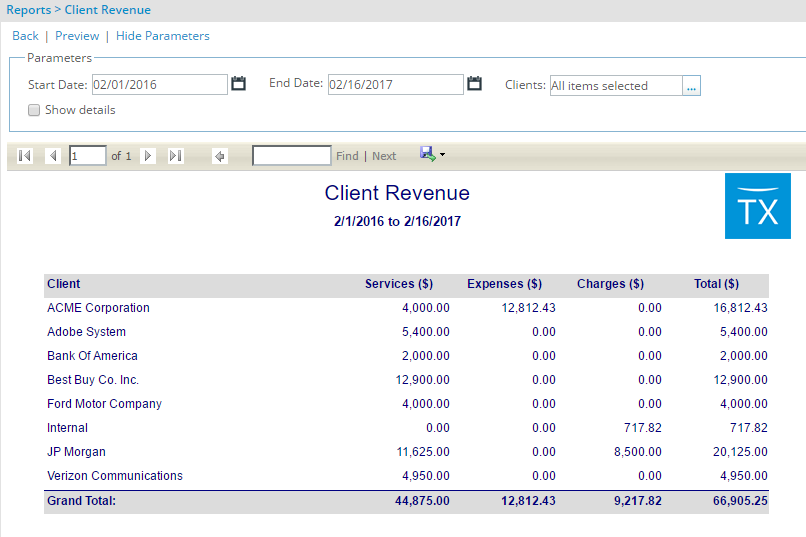
- The Client Revenue report displays the services, expenses, charges and total amount by client, as well as the client totals. To run the Client Revenue report, specify the date range for the selected clients. The Client Revenue report also displays the services, expenses, charges and total amount by project for each selected client when the Show Details check box is selected.
Group Billable Utilization Report
Version note: Available as of Tenrox 2011 R1
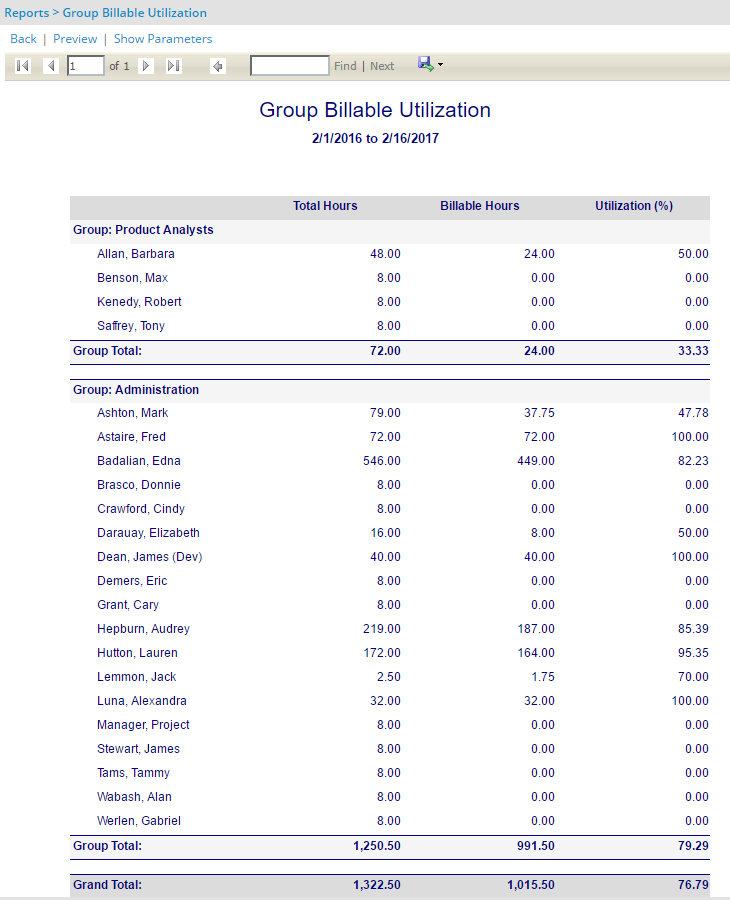
The Group Billable Utilization report is added to the Revenue folder. The Group Billable Utilization report is grouped by resource group and displays the total hours entered, the total billable hours and the billable utilization percentage per resource group, as well as the group and grand totals. To run the Group Billable Utilization report, specify the date range for the selected resource groups.
Group Revenue Report
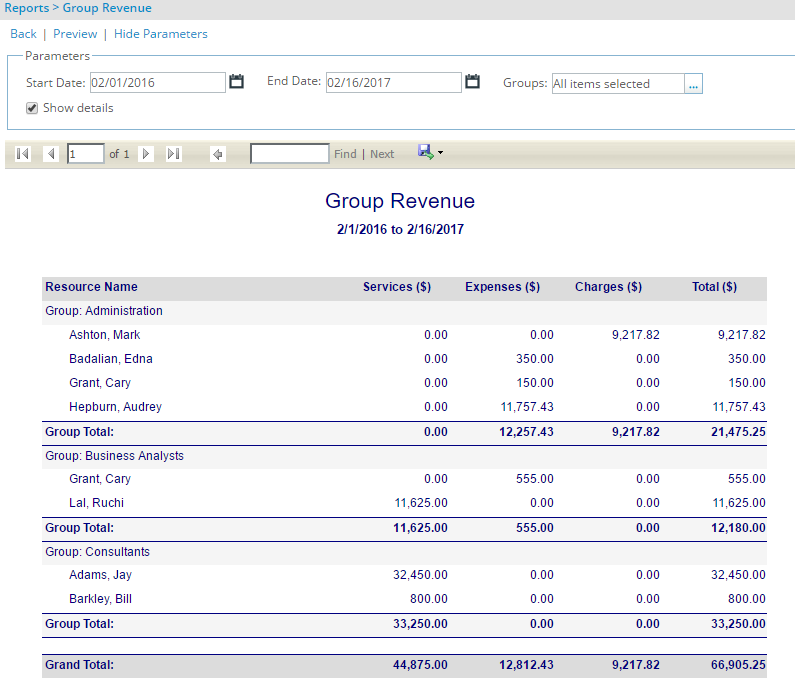
- The Group Revenue report displays the services, expenses, charges and total amount by resource group, as well as the resource group totals. To run the Group Revenue report, specify the date range for the selected resource groups. The Group Revenue report also displays the services, expenses, charges and total amount by resource for each selected resource group when the Show Details check box is selected.
Project Billable Utilization Report
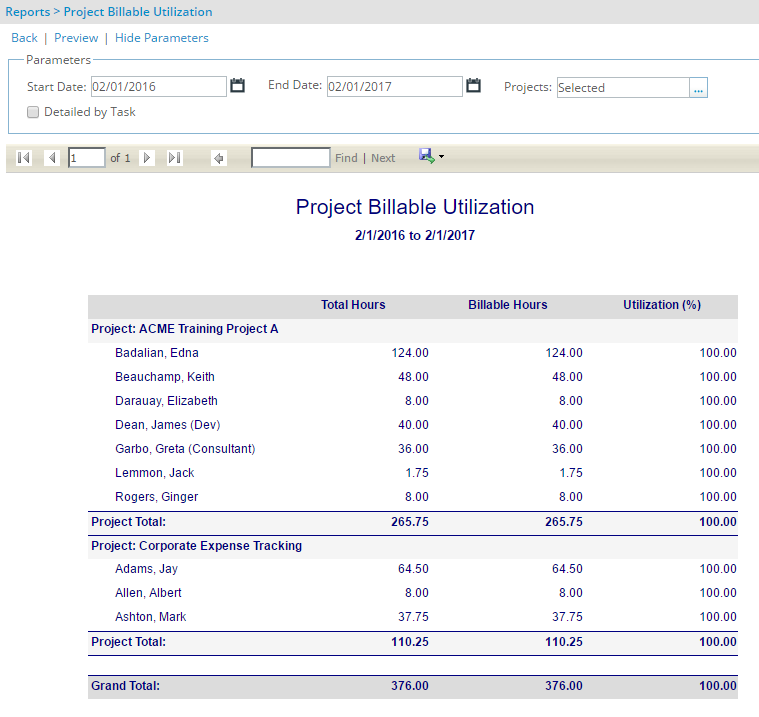
- The Project Billable Utilization report displays the total hours, billable hours and utilization percentage by project. To run the Project Billable Utilization report, specify the date range for the selected projects. The Project Billable Utilization report also displays the information by task for each selected project when the Detailed by Task check box is selected. If the Detailed by Task option is not selected, the report is grouped by project and displays the billable utilization per resource.
Project Revenue Detailed by Resource Report
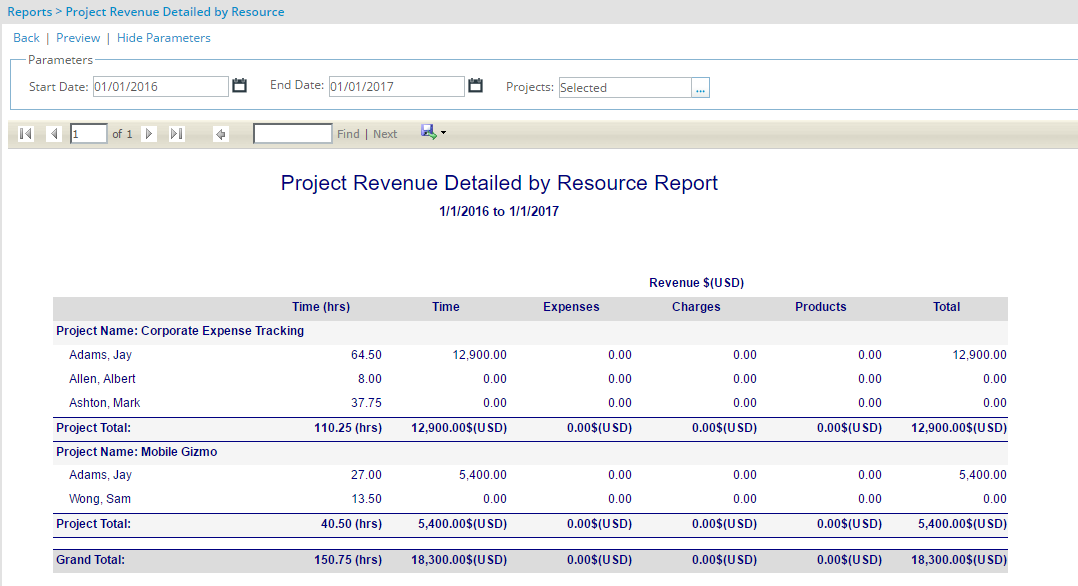
- The Project Revenue Detailed by Resource Report displays by project, the total hours, total time billable amount, total expense billable amount, total charge billable amount and total product billable amount per resource, as well as the project and grand totals. To run the Project Revenue Detailed by Resource Report, specify the date range for the selected projects.
Project Revenue Detailed by Task Report
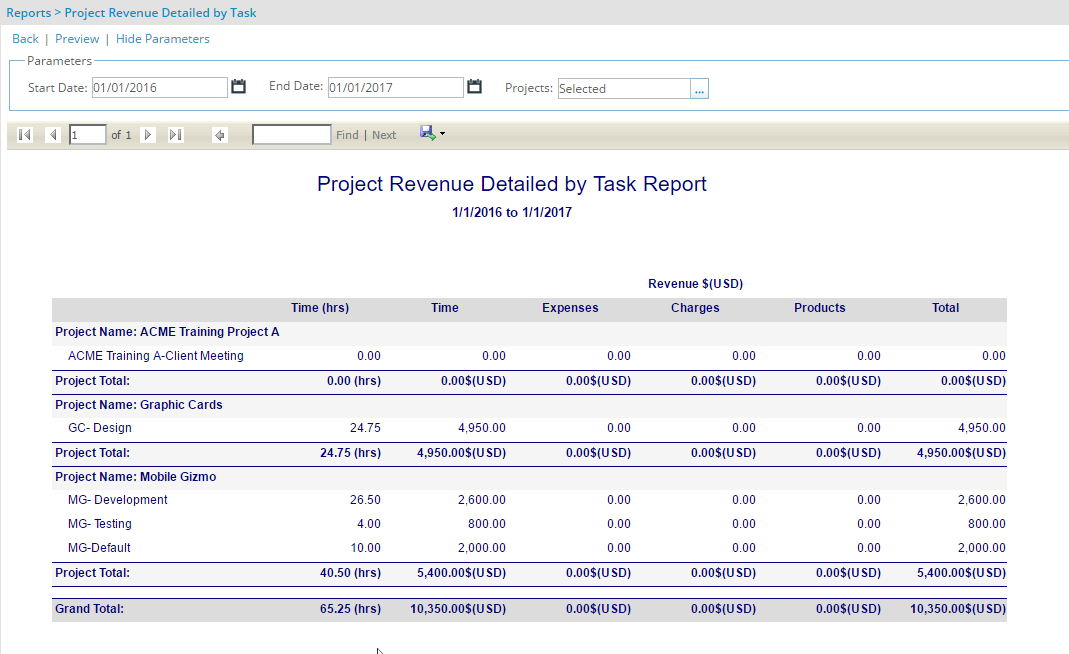
- The Project Revenue Detailed by Task Report displays by project, the total hours, total time billable amount, total expense billable amount, total charge billable amount and total product billable amount per task, as well as the project and grand totals. To run the Project Revenue Detailed by Task Report, specify the date range for the selected projects.
Project Revenue Summary Report
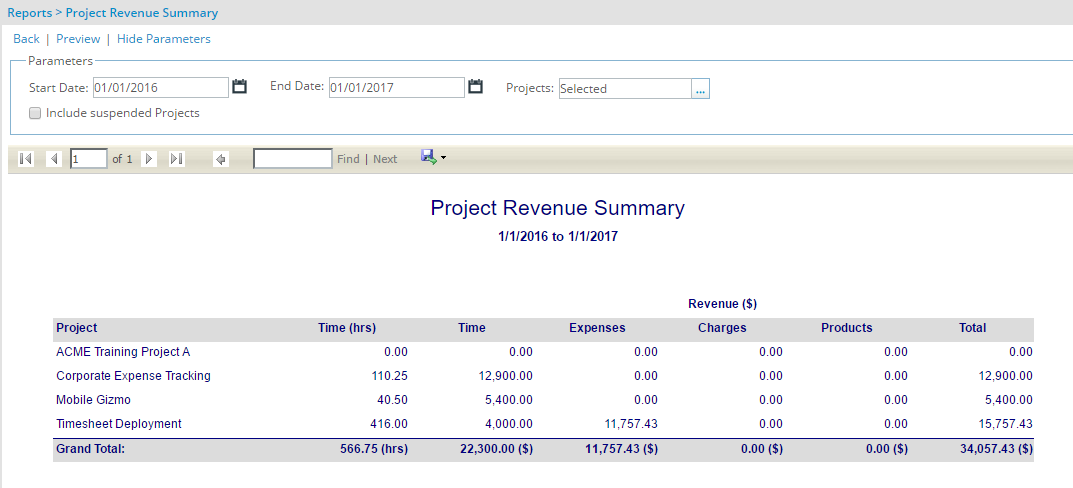
The Project Revenue Summary report displays the time, time amount, expense amount, money charge amount, product amount and total amount by project. To run the Project Revenue Summary report, specify the date range for the selected projects.
Version note: Available as of Tenrox 2013 R1 Addition of the option Include suspended Projects
The Include suspended Projects option allows the choice of displaying, or not, suspended Projects when running the Project Revenue Summary report.
- When this option is checked, which is the default setting, the report functions as it currently does and returns all projects selected through the Projects parameter.
- When this option is unchecked, the report only returns the active Projects (Suspended option unchecked on Project Edit page) from the list of selected Projects through the Projects parameter.
Resource Revenue Rule Information Report
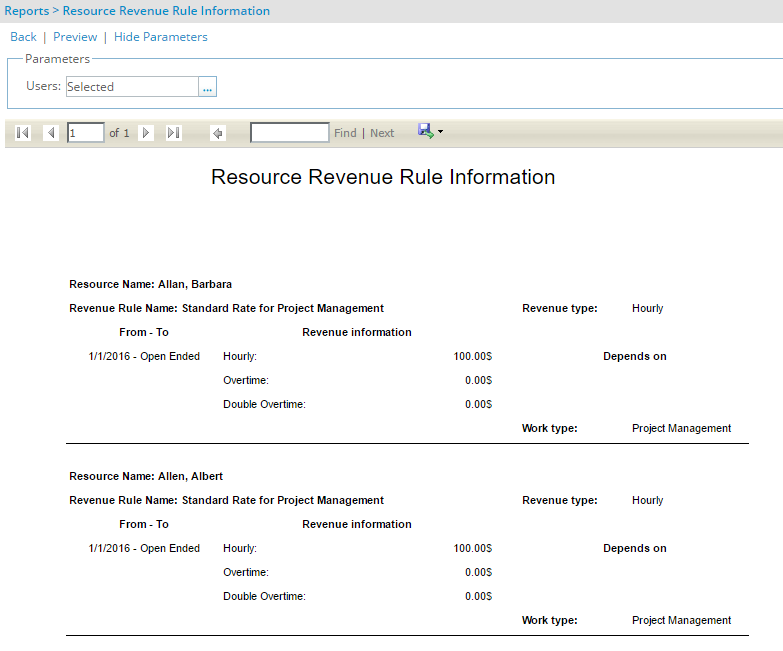
- The Resource Revenue Rule Information report displays by resource, the billing rule association with its dates, rates and dependencies.
Timesheet Folder
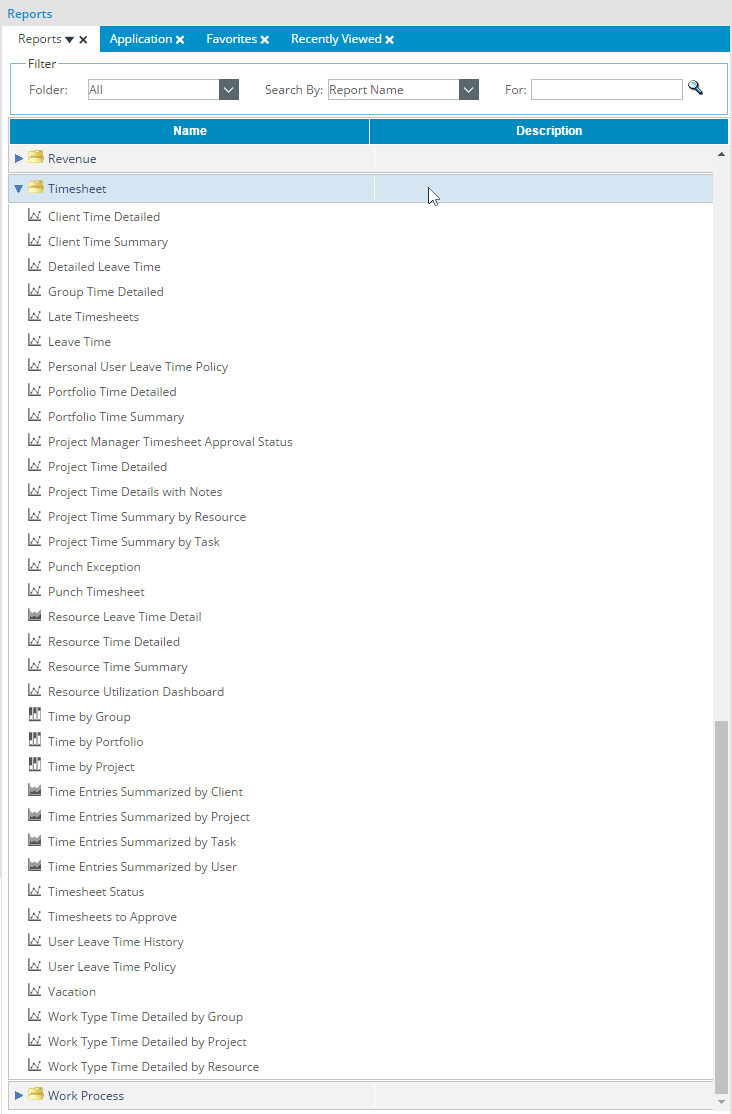
The Timesheet folder contains the following reports:
- Client Time Detailed Report
- Client Time Summary Report
- Detailed Leave Time Report
- Group Time Detailed Report
- Late Timesheets Report
- Leave Time Report
- Portfolio Time Detailed Report
- Portfolio Time Summary Report
- Project Manager Timesheet Approval Status Report
- Project Time Detailed Report
- Project Time Details with Notes Report
- Project Time Summary by Resource Report
- Project Time Summary by Task Report
- Resource Time Detailed Report
- Resource Time Summary Report
- Timesheet Status Report
- Timesheets to Approve Report
- User Leave Time History Report
- User Leave Time Policy Report
- Vacation Report
- Work Type Time Detailed by Group Report
- Work Type Time Detailed by Project Report
- Work Type Time Detailed by Resource Report
Note: The Timesheet folder also contains the Time by Group, Time by Portfolio and Time by Project OLAP reports as long as OLAP licenses exist.
Client Time Detailed Report
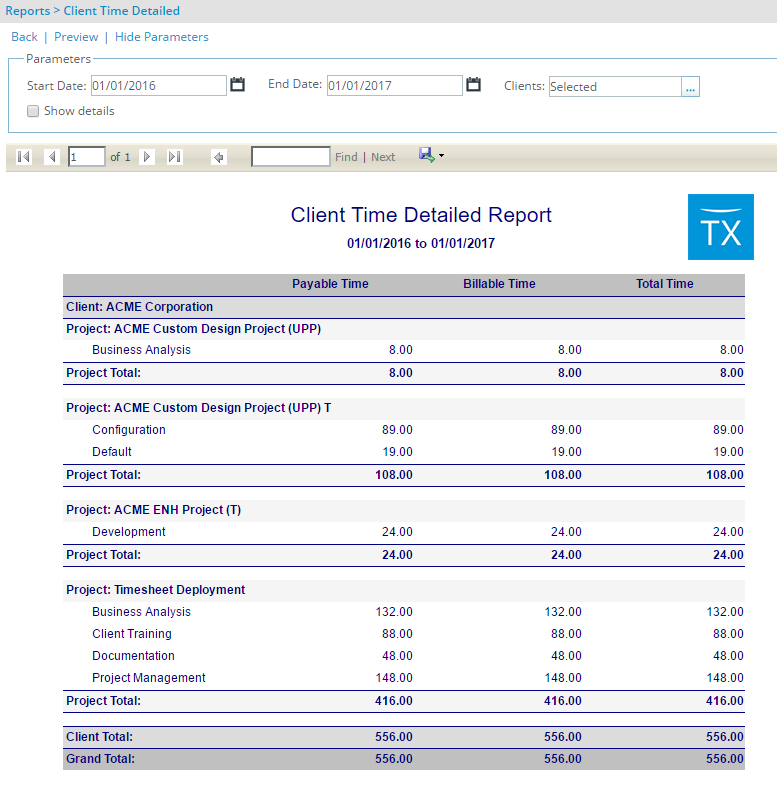
- The Client Time Detailed Report displays the payable time, billable time and total time by client, project and work type, as well the as work type, project and client totals. To run the Client Time Detailed Report, specify the date range for the selected clients. The Client Time Detailed Report also displays the information by resource and date when the Show details check box is selected.
Client Time Summary Report
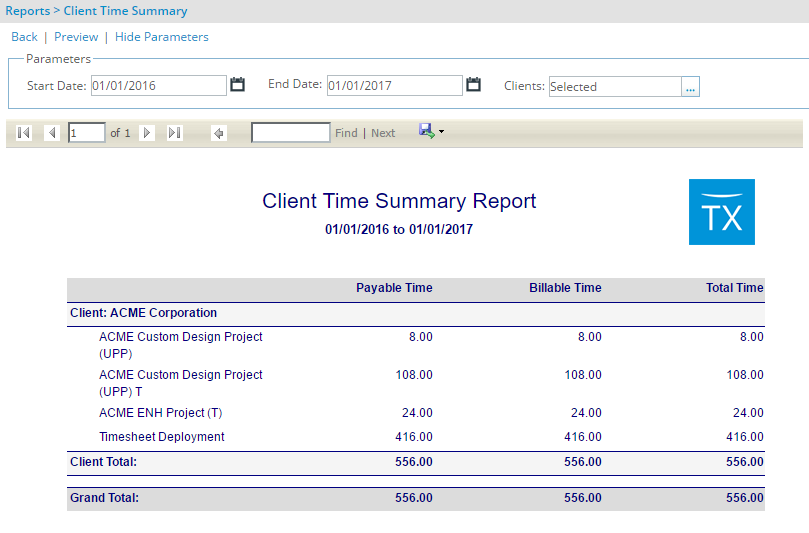
- The Client Time Summary Report displays the payable time, billable time and total time by client and project, as well as client totals. To run the Client Time Summary Report, specify the date range for the selected clients.
Detailed Leave Time Report
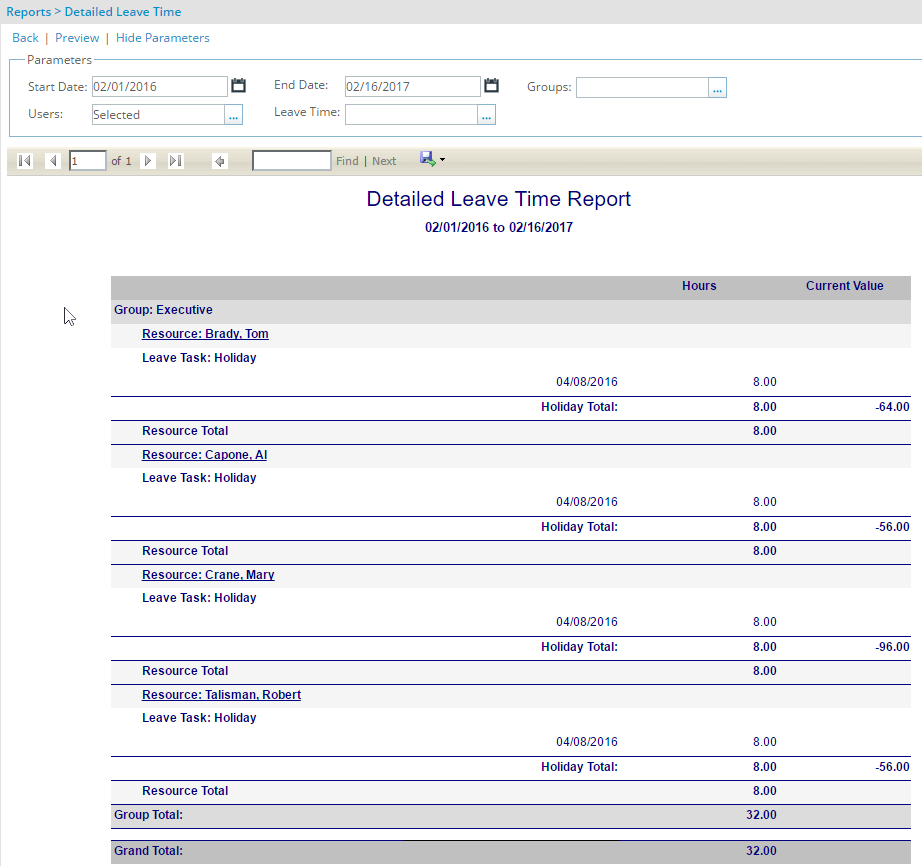
The Detailed Leave Time Report displays the leave time hours by resource group, resource, leave task and date, as well as the group and grand totals. To run the Detailed Leave Time Report, specify the date range for the selected resource groups, resources and leave tasks.
Available as of Tenrox 2011 R1, the Current Value column is added to the Detailed Leave Time Report and the User parameter is renamed Resource. The Current Value column displays the balance of that leave time, excluding borrowed time, for a resource.
Group Time Detailed Report
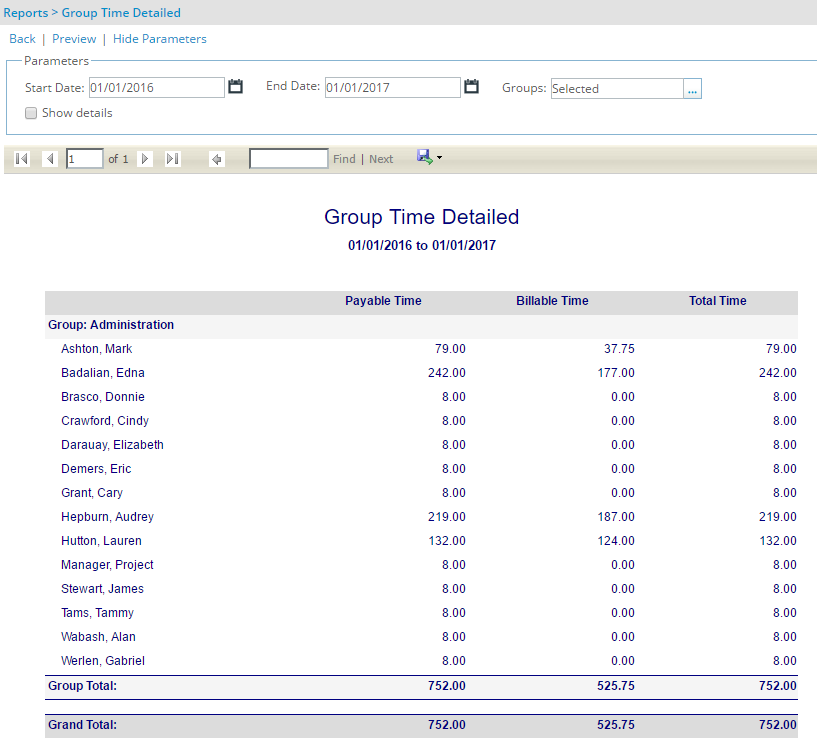
The Group Time Detailed report displays the payable time, billable time and total time by resource group and resource. To run the Group Time Detailed report, specify the date range for the selected resource groups. The Group Time Detailed Report also displays each resource's and corresponding project when the Show details check box is selected. If the Show details check box is clear, only the resources are displayed for the selected resource groups.
Version note: Available as of Tenrox 2011 R1, when the Show details check box is selected, the Group Time Detailed report displays the projects instead of the tasks for the resources.
Late Timesheets Report
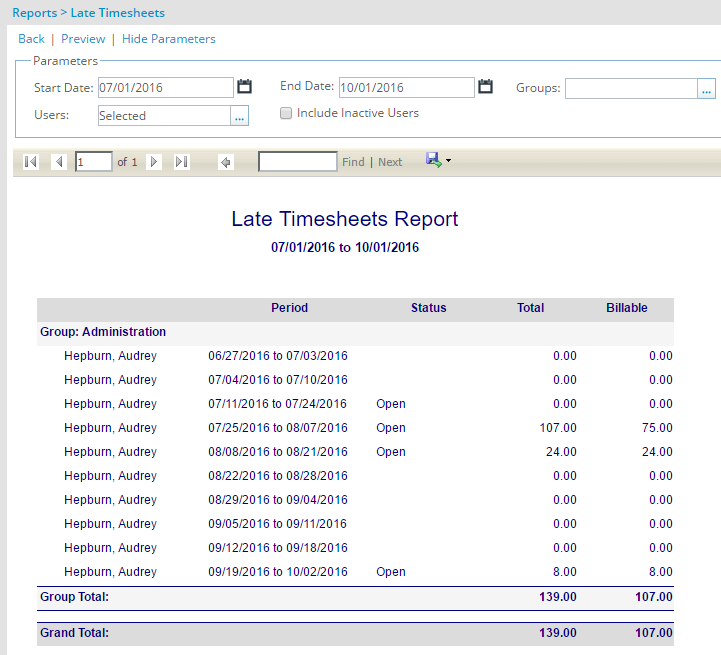
- The Late Timesheets Report displays the timesheet period, timesheet status, total time and billable time by resource group and resource. To run the Late Timesheets Report, specify the date range for the selected resource groups and resources.
Leave Time Report
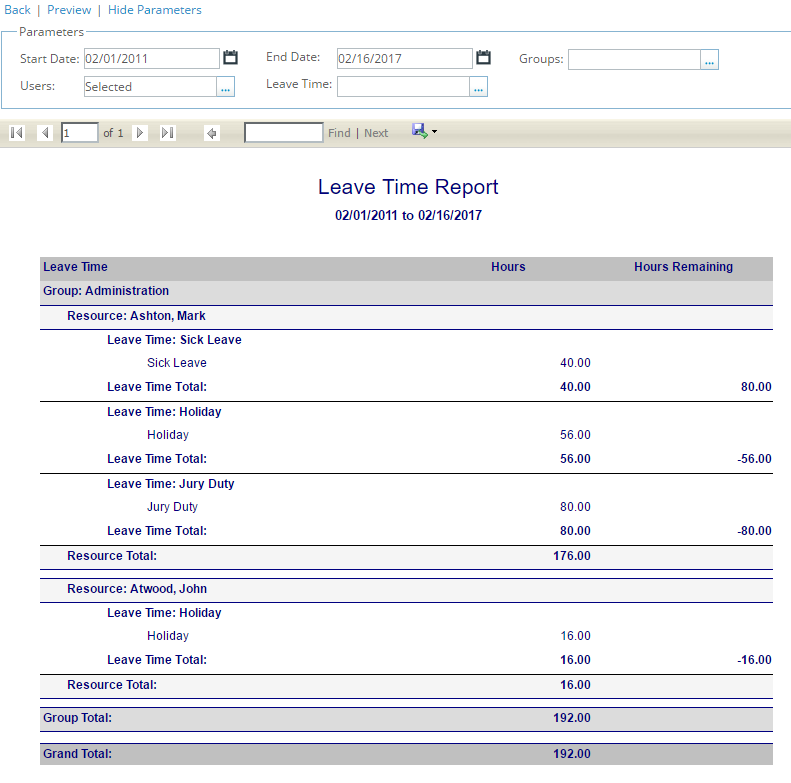
- The Leave Time Report displays the leave time hours and remaining hours by resource group, resource and leave task. To run the Leave Time Report, specify the date range for the selected resource groups, resources, and leave tasks.
Portfolio Time Detailed Report
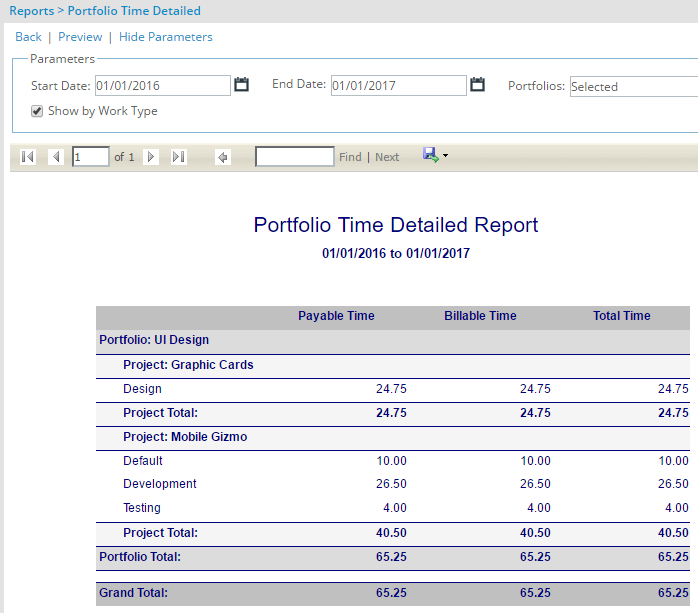
- The Portfolio Time Detailed Report displays the payable time, billable time and total time by portfolio, project and resource. To run the Portfolio Time Detailed Report, specify the date range for the selected portfolios. The Portfolio Time Detailed Report also displays the information by work type when the Show by Work Type check box is selected.
Portfolio Time Summary Report
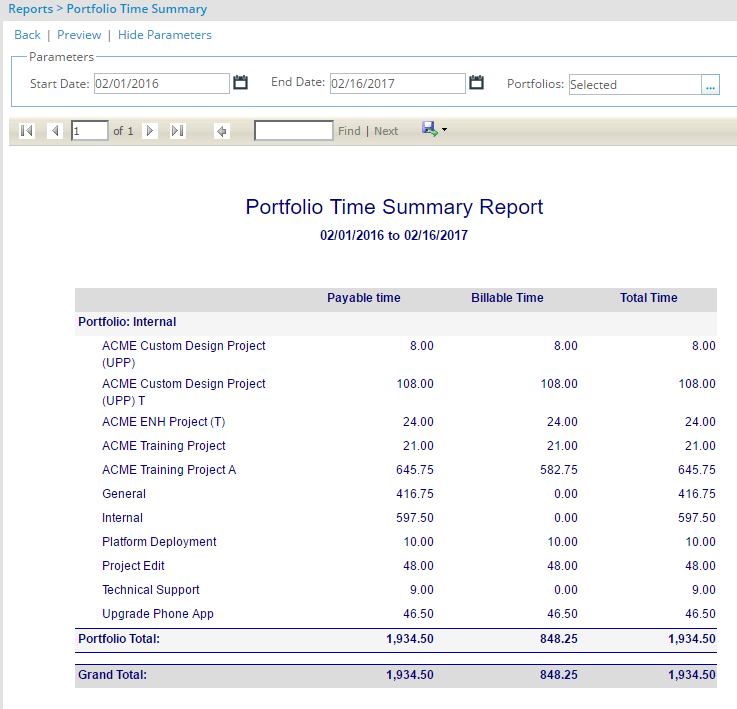
- The Portfolio Time Summary Report displays the payable time, billable time and total time by portfolio and project. To run the Portfolio Time Summary Report, specify the date range for the selected portfolios.
Project Manager Timesheet Approval Status Report
- The PM Timesheet Approval Status report displays the by resource the timesheets that are in a Project Manager (PM) assigned state. To run the PM Timesheet Approval Status report, specify the start date of the timesheet period for the selected groups and resources. The PM Timesheet Approval Status report displays per resource the name of the approver and the approval status of the timesheet.
Project Time Detailed Report
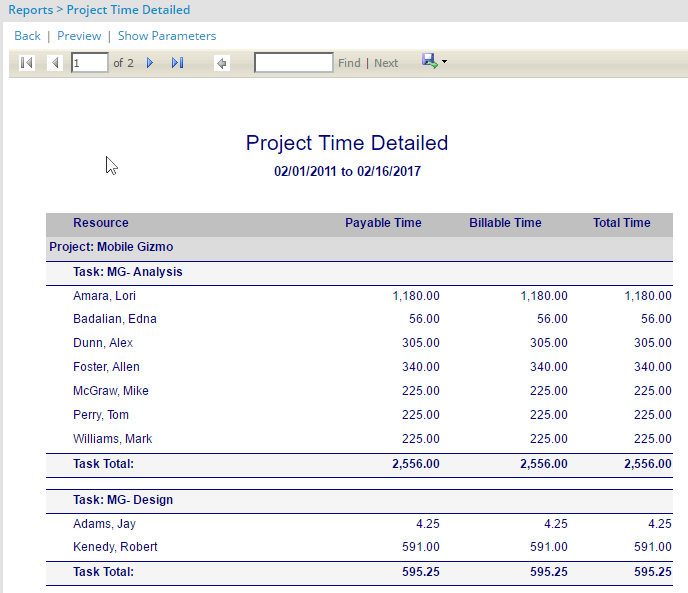
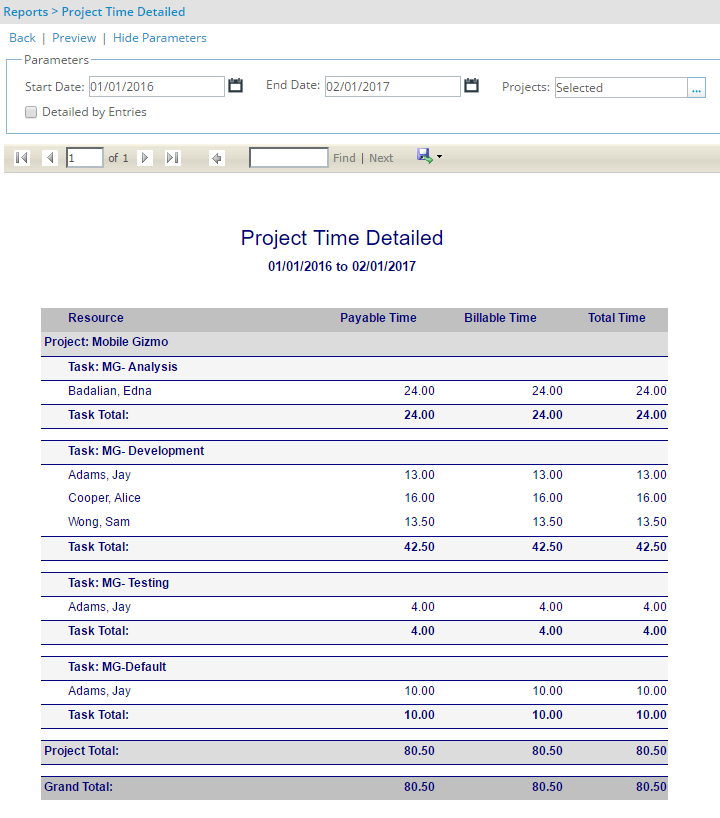
- The Project Time Detailed report displays the payable time, billable time and total time by project, task and resource, as well as the resource, task and project totals. To run the Project Time Detailed report, specify the date range for the selected projects. The Project Time Detailed report also displays the details for each resource by date when the Detailed by Entries check box is selected.
Project Time Details with Notes Report
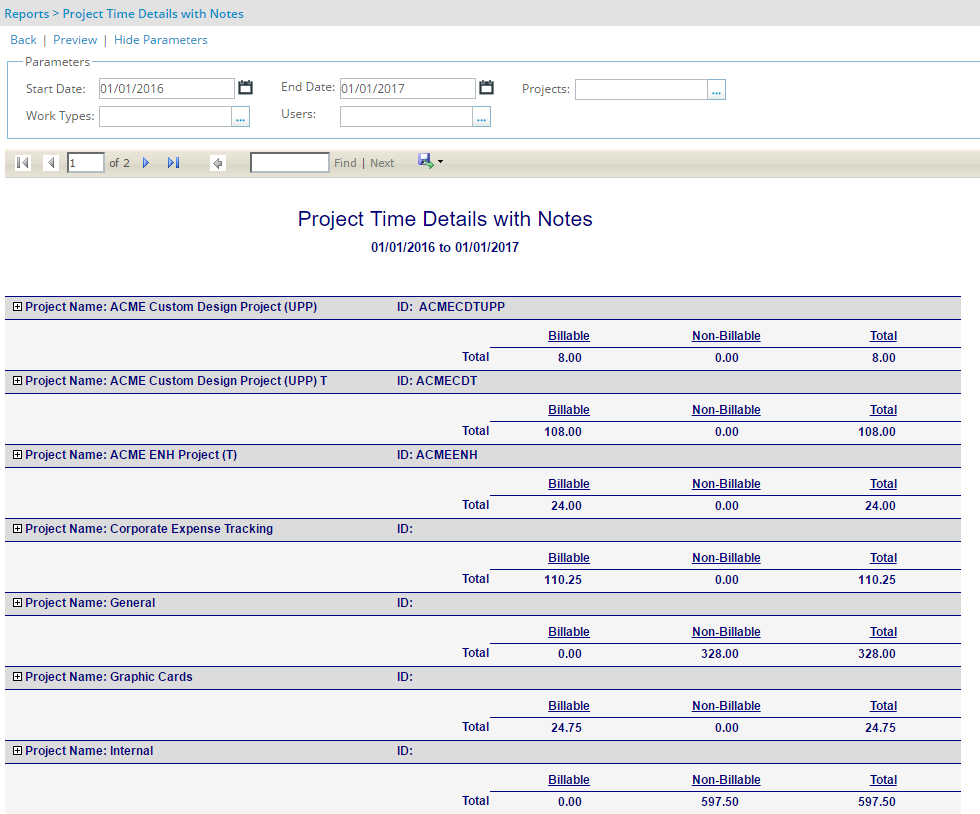
The Project Time Details with Notes report displays by project, the dates that billable and non-billable time is entered per resource against a project's tasks and the corresponding total time for the project, as well as the project and grand totals. The notes entered for any given day are also displayed. To run the Project Time Details with Notes report, specify the date range for the selected projects, work types and resources. The tasks displayed in the Project Time Details with Notes report are filtered to display only the tasks that are associated to the selected work types. If no work types are selected, all the tasks are displayed.
Version note: Available as of Tenrox 2011 R1, the Work Type parameter, as well as the Billable and Non-Billable columns that display the entries marked as billable and non-billable respectively, are added to the Project Time Details with Note report. The Hours column is also renamed Total to display the total time hours instead of only the billable hours.
Project Time Summary by Resource Report
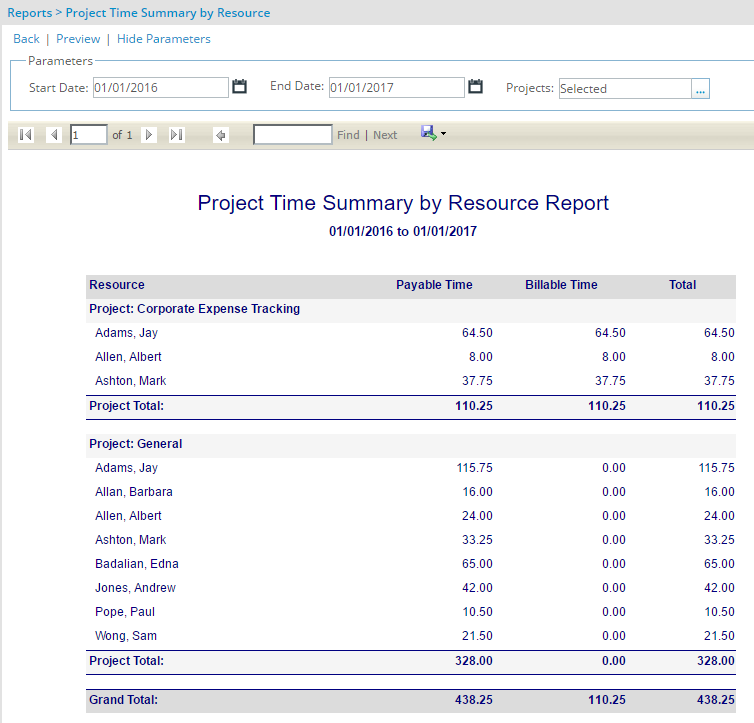
- The Project Time Summary by Resource Report displays by resource, the payable and billable time entries per project and the corresponding total time for the project, as well as the project totals. To run the Project Time Summary by Resource Report, specify the date range for the selected projects.
Project Time Summary by Task Report
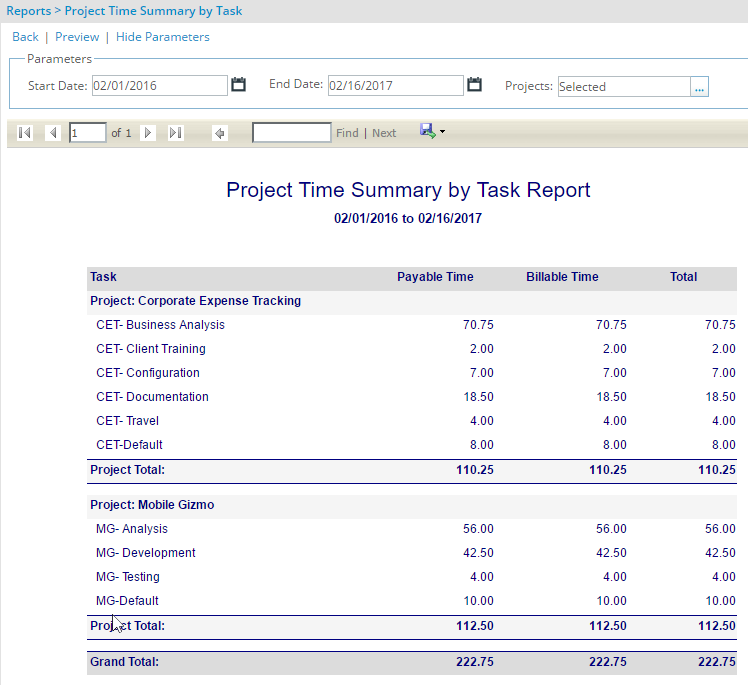
- The Project Time Summary by Task Report displays by task, the payable and billable time entries per project and the corresponding total time for the project, as well as the project totals. To run the Project Time Summary by Task Report, specify the date range for the selected projects.
Resource Time Detailed Report
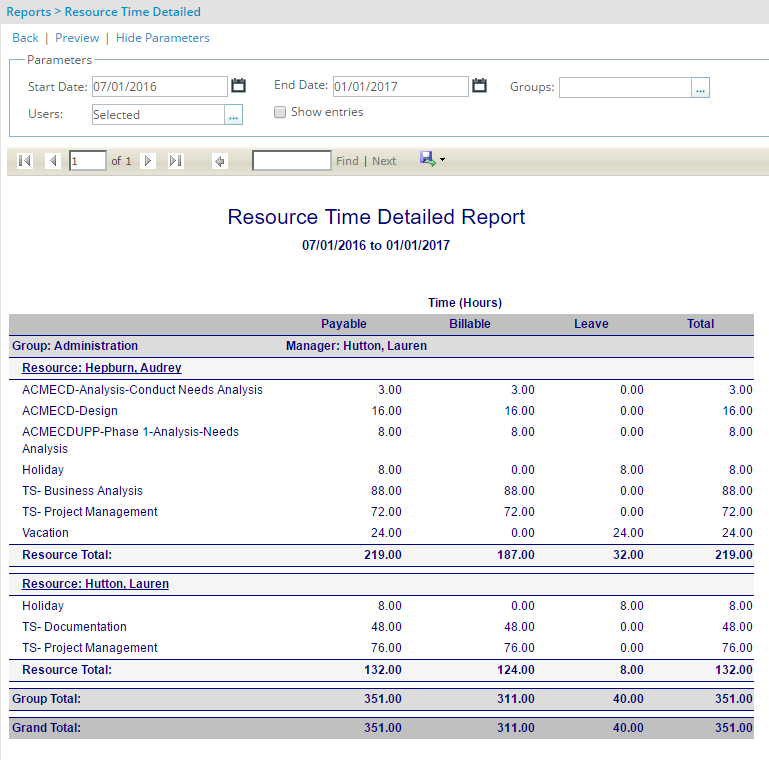
- The Resource Time Detailed Report displays by group, the payable, billable and leave time per resource and the corresponding total time for the resource, as well as resource totals. To run the Resource Time Detailed Report, specify the date range for the selected groups and resources. The Resource Time Detailed Report also displays the time details by date when the Show entries check box is selected.
Resource Time Summary Report
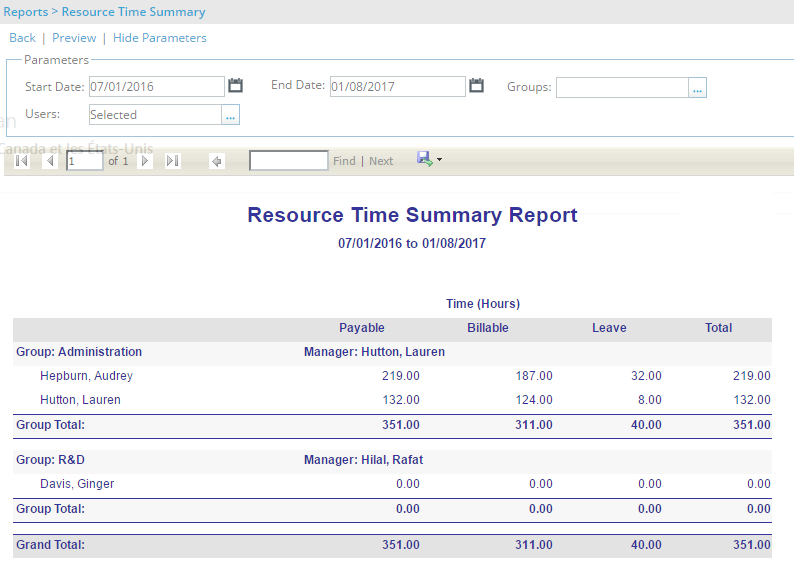
- The Resource Time Summary Report displays by group, the payable, billable and leave time per resource and the corresponding total time for the resource. To run the Resource Time Summary Report, specify the date range for the selected groups and resources.
Timesheet Status Report
Version note: Available as of Tenrox 2011 R1
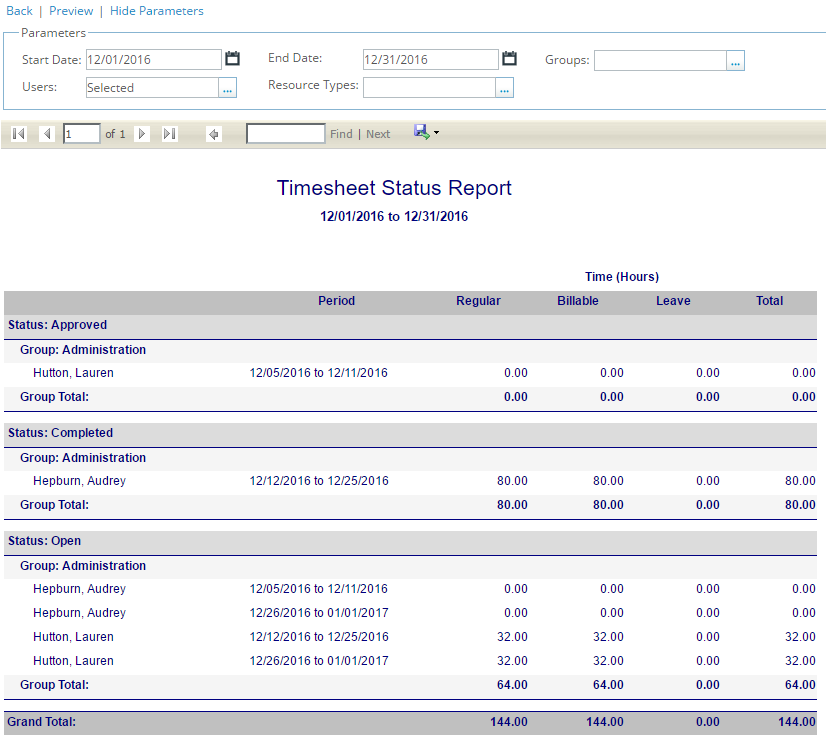
The Timesheet Status Report is added to the Timesheet folder. The Timesheet Status Report displays by status (workflow state), the regular, billable, leave time and total hours per resource group for the specified timesheet period, as well as the group totals. To run the Timesheet Status Report, specify the date range for the selected groups, resources and resources types. For each resource group, a list of resources is displayed having a timesheet within the selected date range.
Timesheets to Approve Report
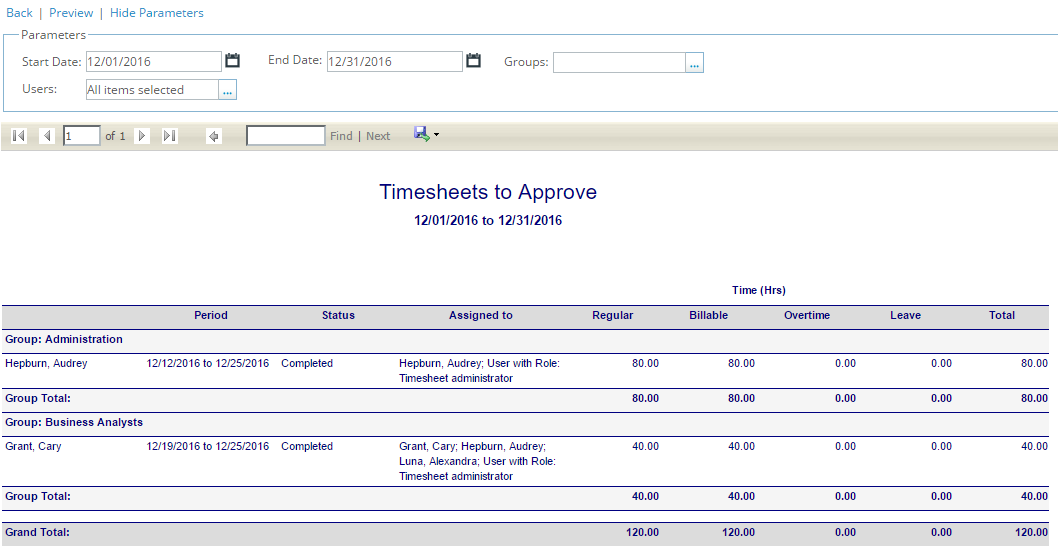
The Timesheets to Approve report displays by resource group, the timesheets that have an approval transition from the current state, as well as the group and grand totals. To run the Timesheet to Approve report, specify the date range for the selected groups and resources. For each resource group, a list of timesheets is displayed per resource within the selected date range. The Timesheets to Approve report displays the following information:
- Group: resource group with the assigned resources
- Period: timesheet period
- Status: status of the timesheets
- Assigned to: names of the users assigned to the timesheets
- Regular: total hours entered for regular time
- Overtime: total hours entered for the overtime and double overtime
- Leave: total hours entered for the leave time
- Total: sum of all the time entries
Version note: Available as of Tenrox 2011 R1, the Unapproved Timesheets Report is renamed Timesheets to Approve report.
User Leave Time History Report
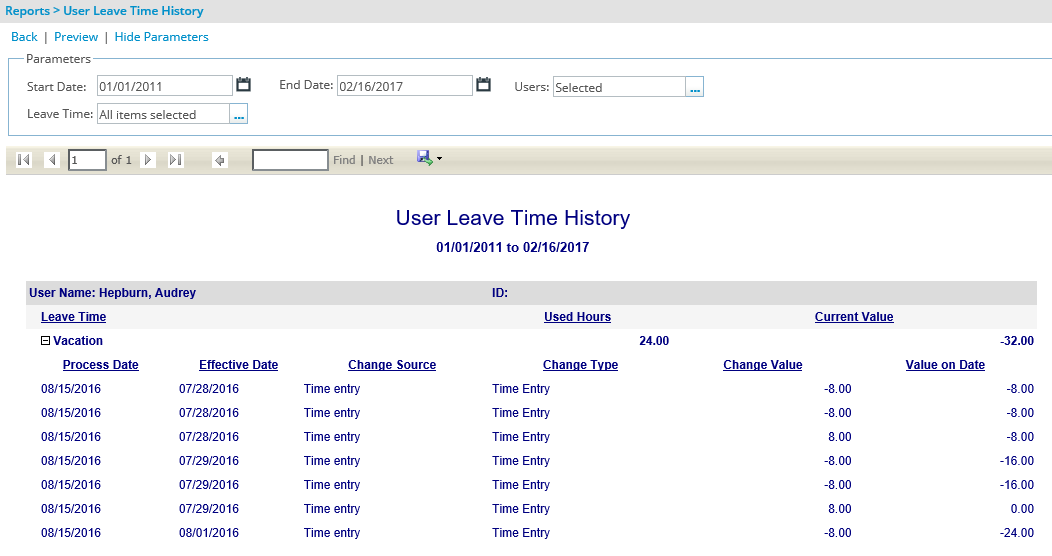
The User Leave Time History report displays by resource, the dates that the changes are implemented and take effect for the leave time tasks, as well as the leave time use. To run the User Leave Time History report, specify the date range for the selected resources and leave tasks.
Version note: Available as of Tenrox 2011 R1, the Process Date column is added to the User Leave Time History report and Date column is renamed Effective Date. The User Leave Time History report can now be sorted by ascending order or the Process Date.
User Leave Time Policy Report
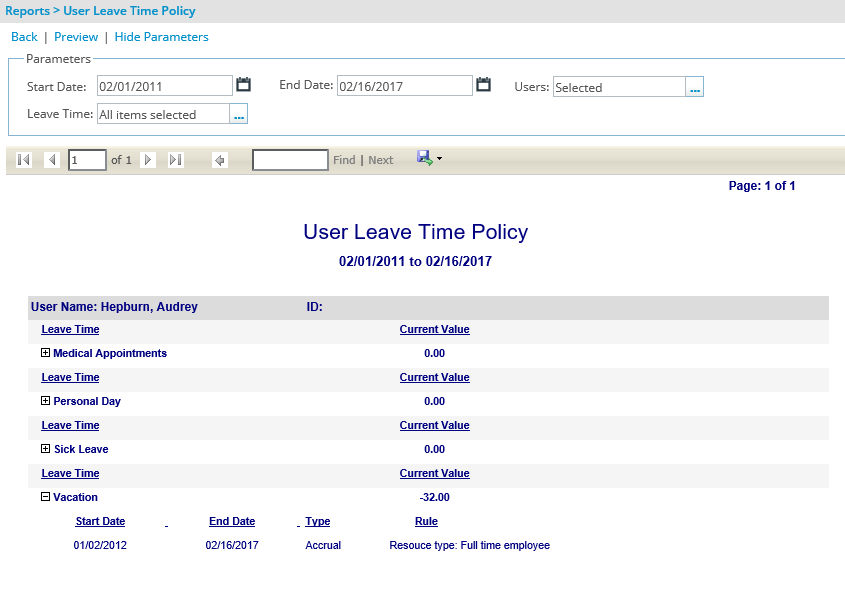
- The User Leave Time Policy report displays by resource, the processing rules applicable to the leave times within the specified date range. To run the report User Leave Time Policy report, specify the date range for the selected resources and leave tasks.
Vacation Report
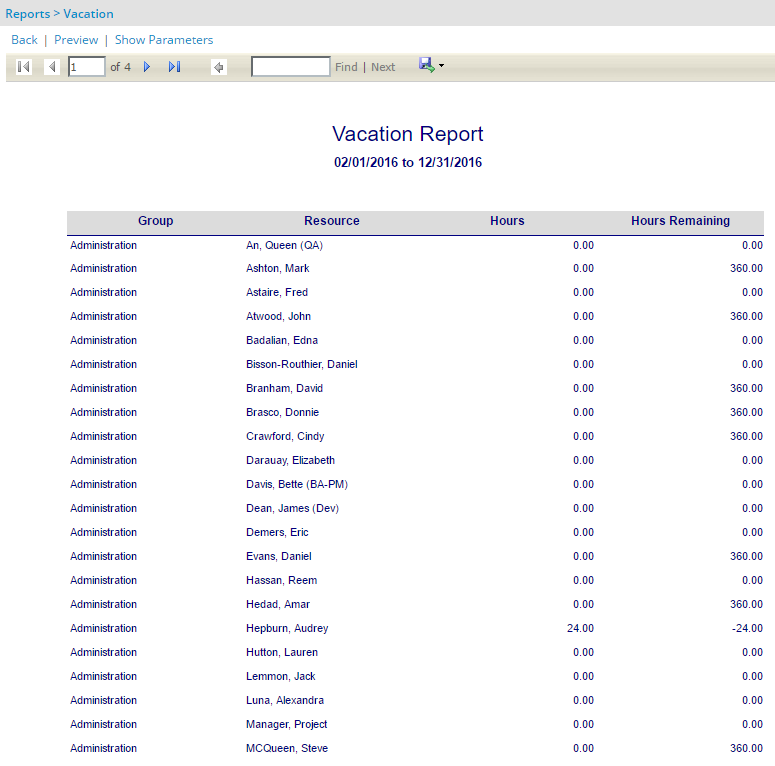
- The Vacation Report displays by resource group, the total vacation leave time approved per resource and the remaining vacation leave time for the specified period. To run the Vacation Report, specify the date range.
Work Type Time Detailed by Group Report
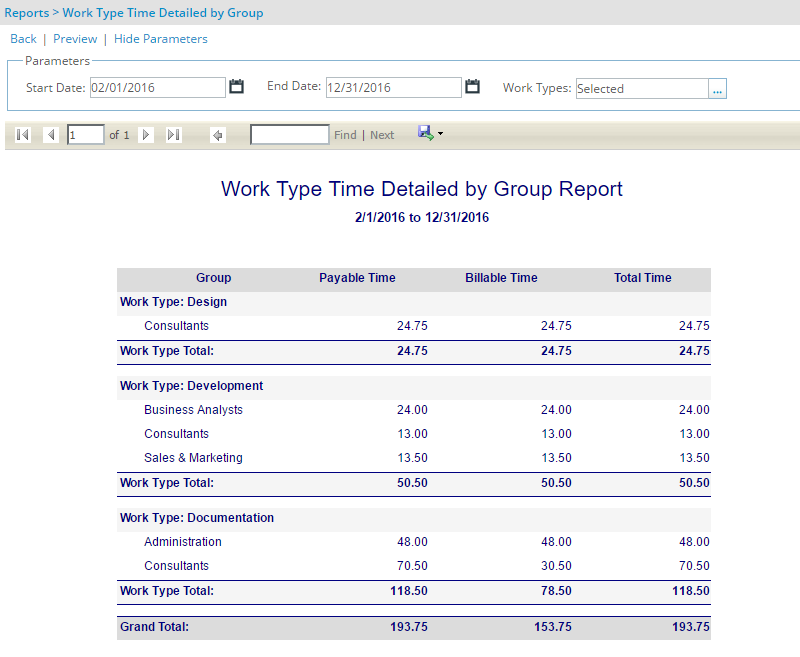
- The Work Type Time Detailed by Group Report displays by resource group, the payable time, billable time and total time per work type, as well as the work type and grand totals. To run the Work Type Time Detailed by Group Report, specify the date range for the selected work types.
Work Type Time Detailed by Project Report
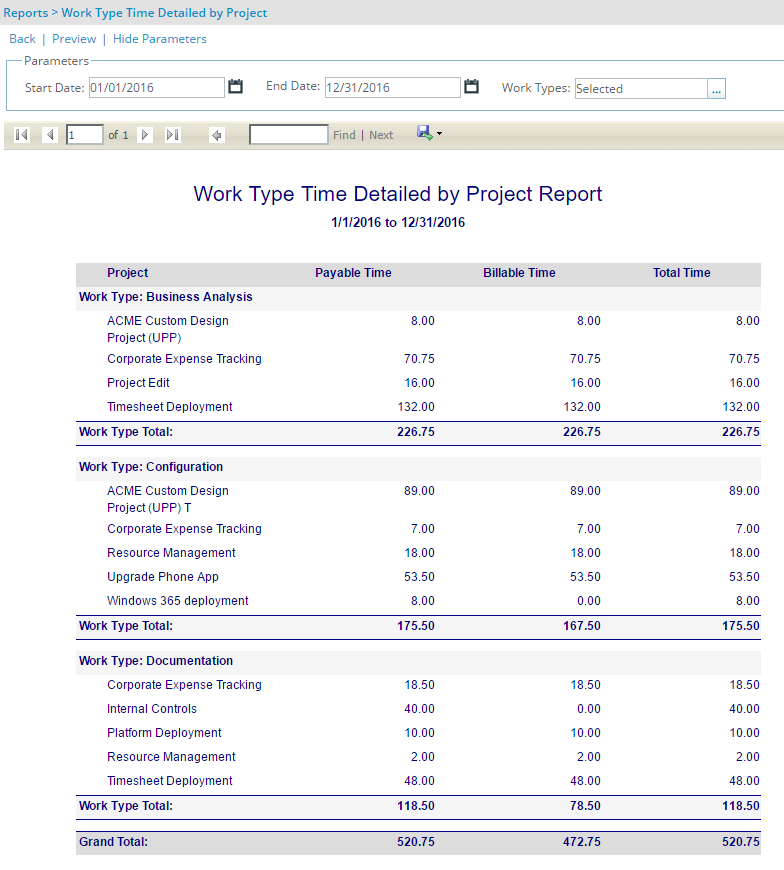
- The Work Type Time Detailed by Project Report displays by project, the payable time, billable time and total time per work type, as well as the grand totals. To run the Work Type Time Detailed by Group Report, specify the date range for the selected work types.
Work Type Time Detailed by Resource Report
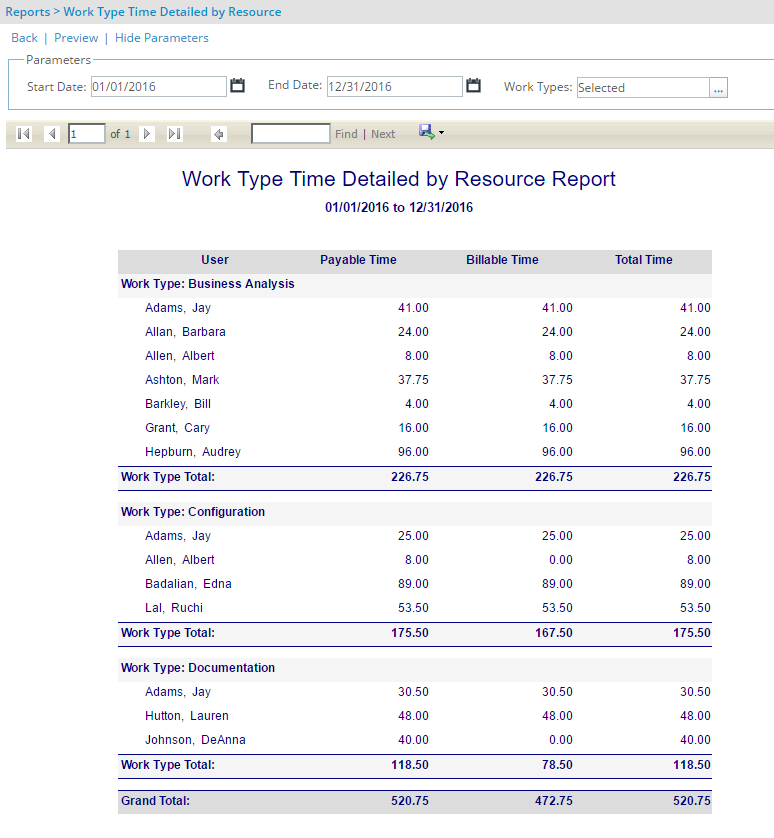
- The Work Type Time Detailed by Resource Report displays by resource, the payable time, billable time and total time per work type, as well as the grand totals. To run the Work Type Time Detailed by Resource Report, specify the date range for the selected work types.
Work Process Folder
The Work Process folder contains that following reports:
- Aged Work Process Entries Report
- Inactive Work Process Entries Report
- Outstanding Work Process Entries Report
Aged Work Process Entries Report
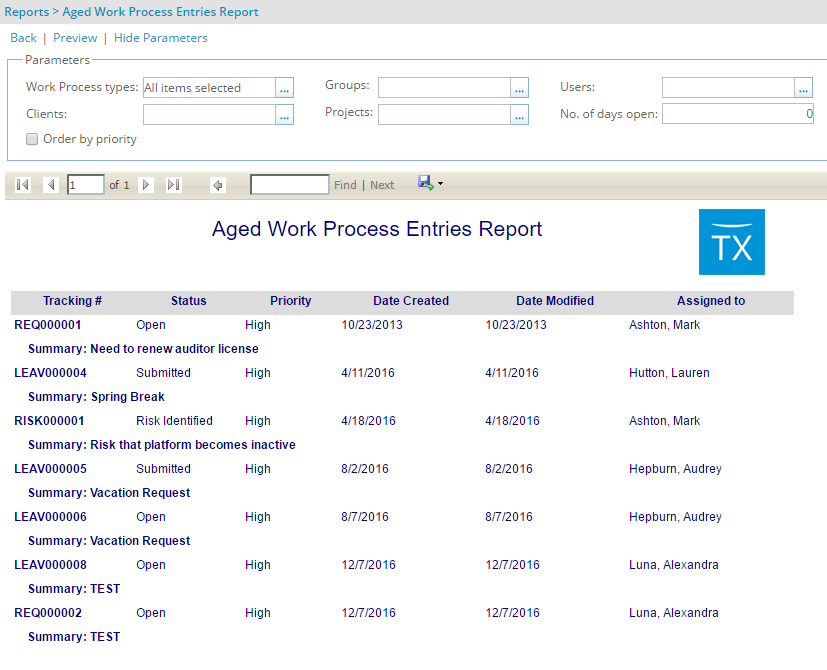
- The Aged Work Process Entries Report displays the aged work process entries that are open for the number of days specified. The Aged Work Process Entries Report displays the tracking number, status, priority, date created and modified, and the resources assigned the work process entries. To run the Aged Work Process Entries Report, select the work process types, resource groups, resources, clients, projects and number of days the work process entries are open. The Aged Work Process Entries Report also sorts the results by priority when the Order by priority check box is selected.
Inactive Work Process Entries Report
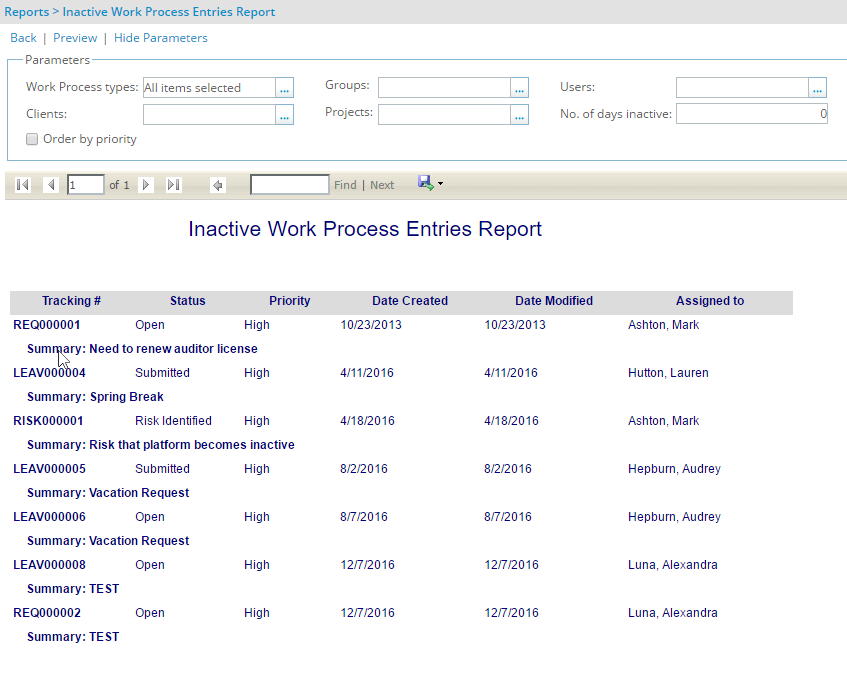
- The Inactive Work Process Entries Report displays the inactive work process entries that are open for the number of days specified. The Inactive Work Process Entries Report displays the tracking number, status, priority, date created and modified, and the resources assigned the work process entries. To run the Inactive Work Process Entries Report, select the work process types, resource groups, resources, clients, projects and number of days the work process entries are open. The Inactive Work Process Entries Report also sorts the results by priority when the Order by priority check box is selected.
Outstanding Work Process Entries Report
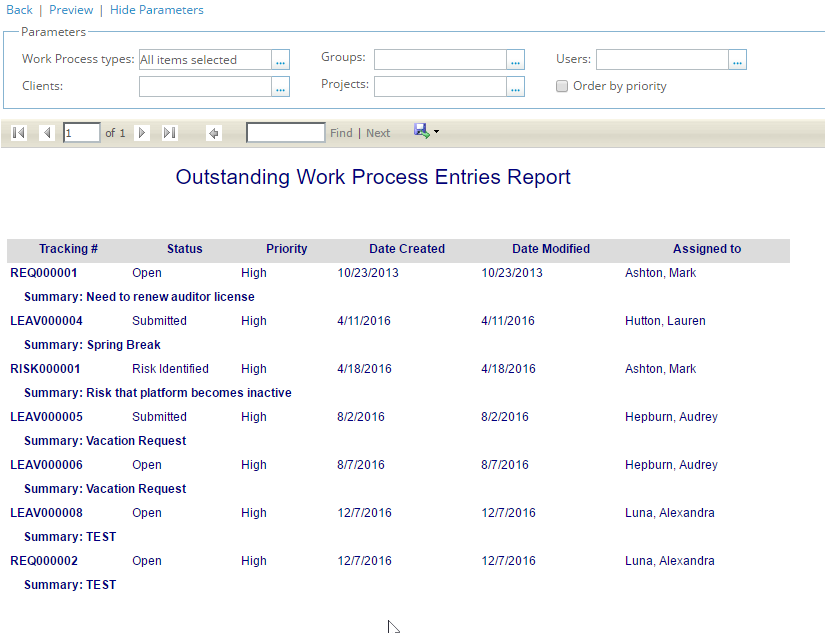
- The Outstanding Work Process Entries Report displays the outstanding work process entries. The Outstanding Work Process Entries Report displays the tracking number, status, priority, date created and modified, and the resources assigned the work process entries. To run the Outstanding Work Process Entries Report, select the work process types, resource groups, resources, clients, and projects. The Outstanding Work Process Entries Report also sorts the results by priority when the Order by priority check box is selected.
