What is Upland Analytics?
Upland Analytics is a new addition to the existing line of reporting capabilities, an ad-hoc reporting tool with a great deal of flexibility, including the following:
- Ability to connect multiple data sources
- Ability to create multiple charts, gauges and maps
- Drill-in / sub-reports
This allows for more intricate reporting, such as the ability to join views, and capturing both detailed and summary information in one report. In addition, there are a number of out-of-the-box reports available.
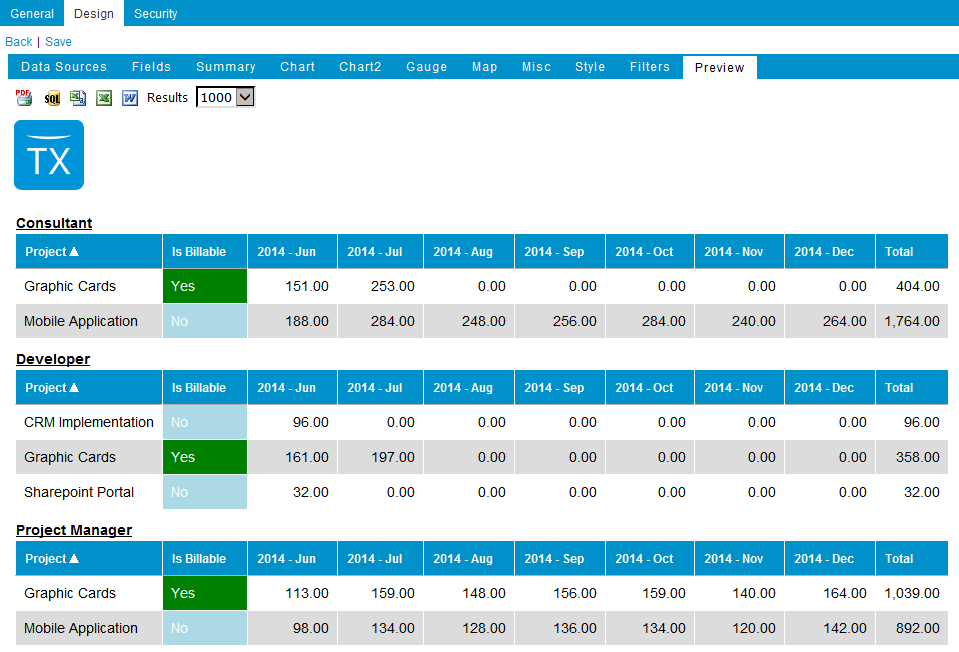
This tool permits self-serve reporting, facilitates the creation of reports and dashboards with impressive charting capabilities. An example of a report is shown below.
The Upland Analytics feature will be subject to licensing, with two different options available in the first release for a given client:
- Read-only reports and dashboards (Tier 1)
- Full-access reports and dashboards (Tier 2)
Version note: This feature is available as of Tenrox 2014 R2.
Note:
As of Tenrox 2018 R1.6, as a result of the addition of the new Upland Analytics reporting capability, the original Upland Analytics Report has been renamed to “Advanced Report” and the original Upland Analytics Dashboard has been renamed to “Advanced Dashboard”.
For more information on the new Upland Analytics module available as of Tenrox2018 R1 SP6 click here.
