Create a Dashboard
You can create a dashboard that displays summaries of different reports, charts and graphs on a single page.
- Click the Create button on the Main Menu bar.
- Select Dashboard from the menu.
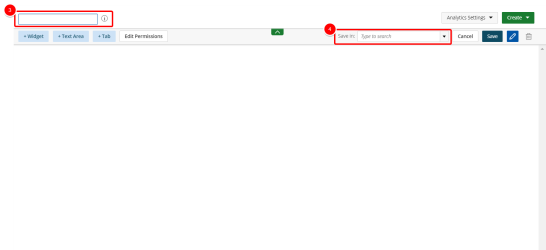
- Type a name for the new dashboard.
- Do one of the following in the Saved in box:
- Type values in the Type to search box to filter and find the folder where your dashboard will be saved.
- Click the arrow to view and select an available folder where your dashboard will be saved, or select Add New Folder to create a new folder where your dashboard will be saved.
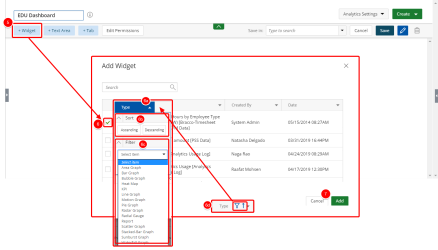
- Click Widget. The Add Widget dialog box displays.
- Select the widgets you want to add to your dashboard. Sort and filter the Type, Name, Created By, and Date columns as desired:
- Click the arrow button next to the desired column.
- Select Ascending or Descending to sort the column.
- Click the arrow button next to Select item and select the item by which to filter. An icon displays when the column is sorted and/or filtered.
- Click Add .
- Repeat steps 5 - 7 to add more widgets, as necessary.
- Optional: Click Text Area to add a text to the dashboard. For more information, see Add a Text Area.
- Optional: Click Tab to add a tab to the dashboard. For more information, see Add a Tab.
- Click Save.

