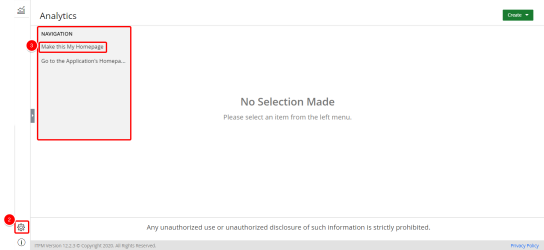
Set Up a Report, Graph/Chart, or Dashboard as My Home Page
You can set a report, graph/chart, or dashboard as your home page. When a report, graph/chart, or dashboard is on your home page, you have the latest information directly at your fingertips by clicking on the Analytics menu.
You must first create the report, graph/chart, or dashboard you want to display on your home page.
 on the