KPI Settings
Select one or more of the available report settings tabs:
General Tab
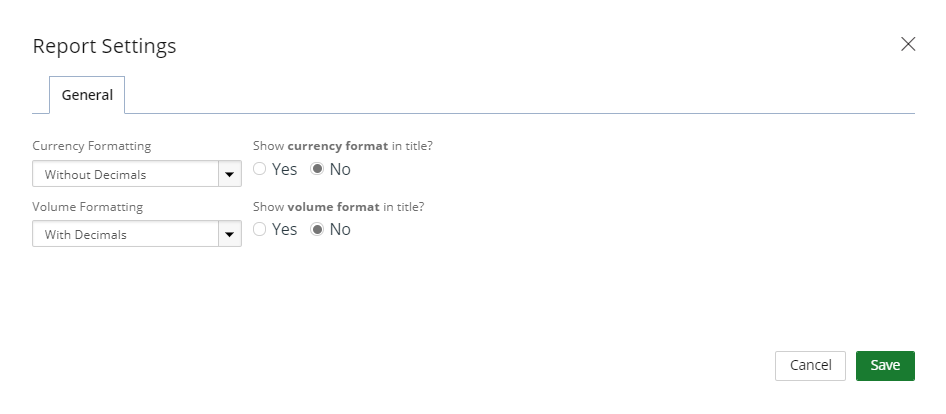
- Select one of the Currency Formatting options:
- Inherited: Selected by default
- With Decimals: 1,000.00
- Without Decimals: 1,000
- Thousands: 100,000.00 or 100,000
- Thousands with decimals: 100.00
- Millions: 1,000,000.00 or 1,000,000
- Millions with decimals: 1.00
- Select one of the Show currency format in title options:
- Yes: Display the currency format on the report/graph title.
- No: Hides the currency format on the report/graph title.
- Select one of the Volume Formatting options:
- Inherited: Selected by default
- With Decimals: 1,000.00
- Without Decimals: 1,000
- Thousands: 100,000.00 or 100,000
- Thousands with decimals: 100.00
- Millions: 1,000,000.00 or 1,000,000
- Millions with decimals: 1.00
- Select one of the Show volume format in title options:
- Yes: Displays the volume format on the report/graph title.
- No: Hides the volume format on the report/graph title.
Note: This option is not available when Inherited is selected in the Currency Formatting drop-down menu.
Note: This option is not available when Inherited is selected in the Volume Formatting drop-down menu.
Note: Click Save at anytime to view your changes.
Kpi Tab
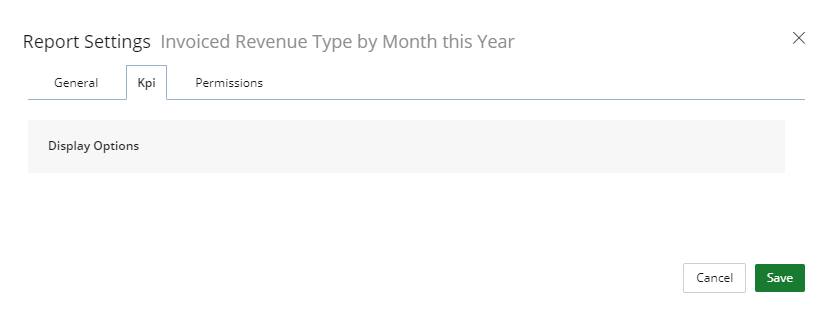
Available Display Options for a KPI.
Note: Click Save at anytime to view your changes.
Version Override Tab
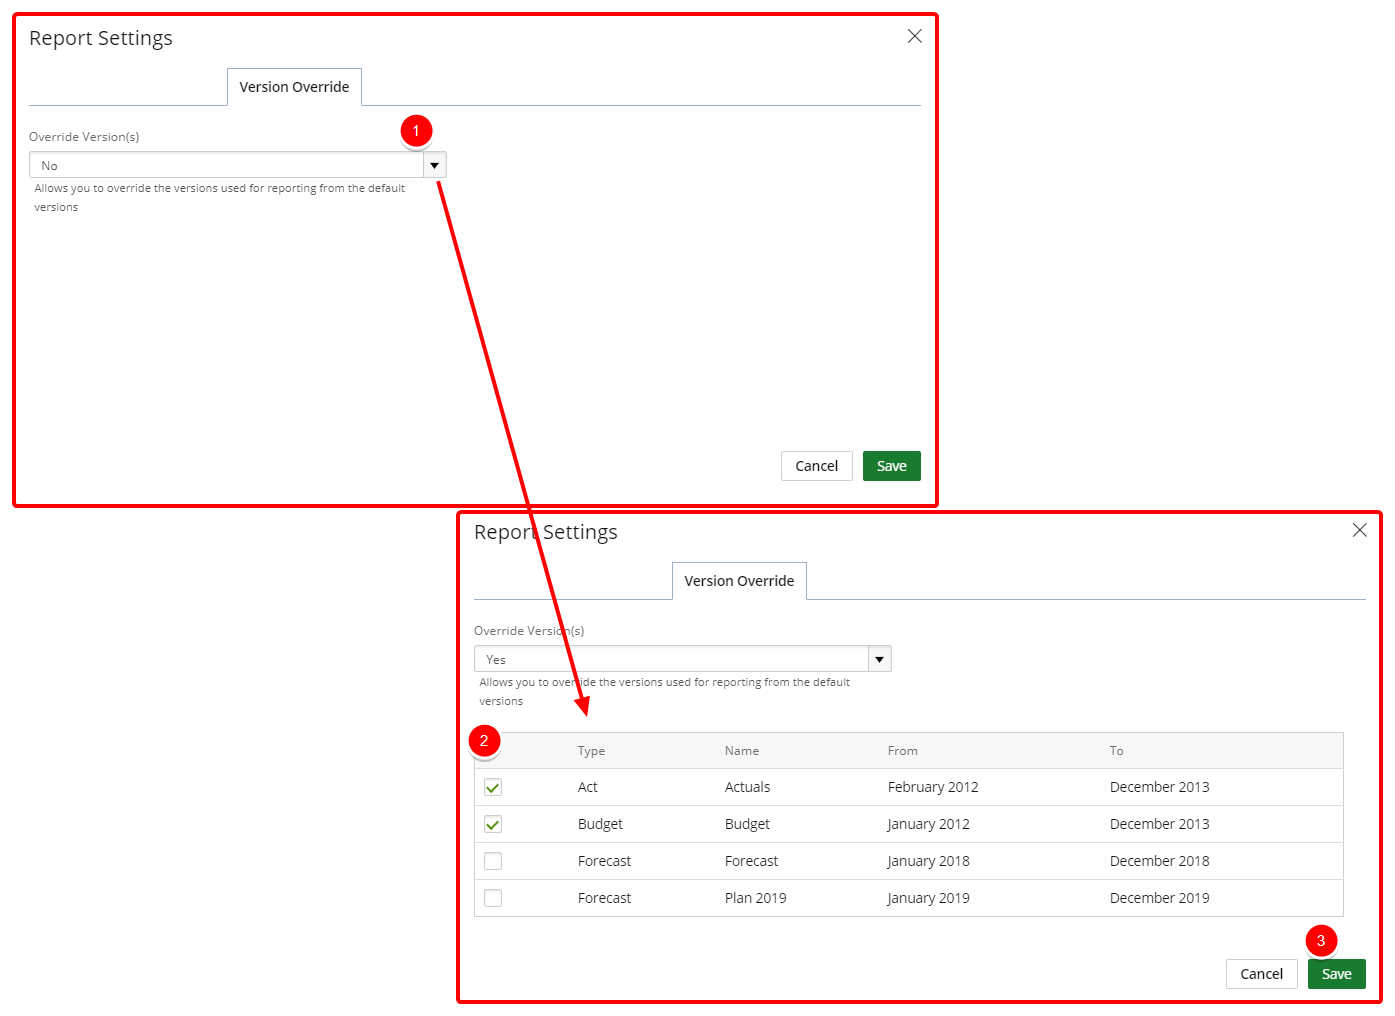
Override the versions used for reporting from the default versions.
- Select Yes from the Overrride Version(s) drop-down menu. A list of default versions display.
- Select the checkbox next to one or more default versions on which you want to report.
- Click Save.
Permissions tab
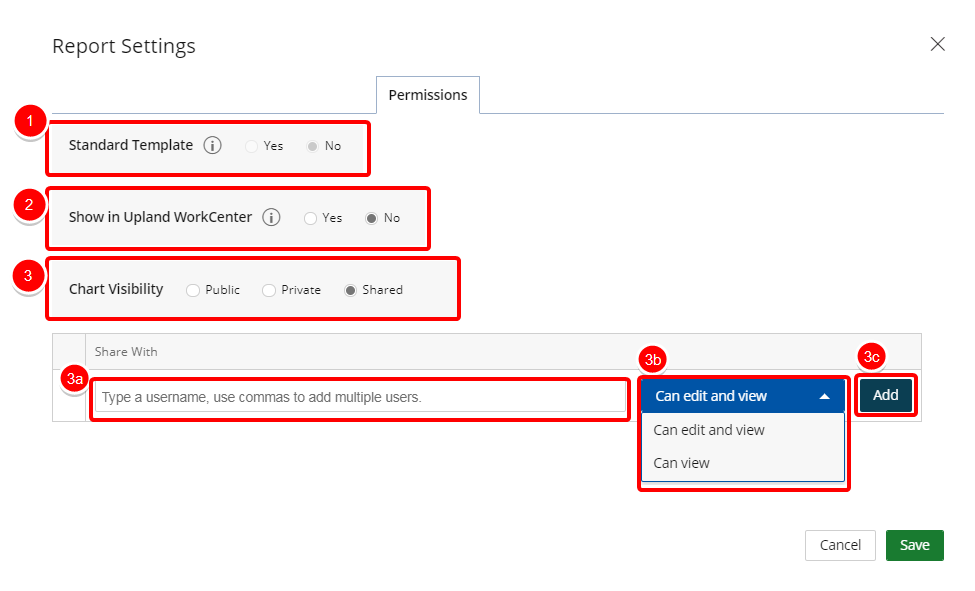
- Standard Template: Select whether or not to use the standard template.
- Show in Upland WorkCenter: Select whether or not to display the report or graph/chart in Upland WorkCenter.
- Yes: The report is available in Upland WorkCenter.
- No: The report is not available in Upland Workcenter.
- Report/Chart Visibility: Select one of the following:
- Public: Allows your report or graph/chart to be viewed and edited by all users. By default, this option is selected.
- Private: Allows your report or graph/chart to be viewed and edited by you only.
- Share: Allows you to set your report or graph/chart to be viewed by a specific user(s) or role(s) and give permissions. The Shared With field displays:
- Click the Select a value field and select the user(s) or role(s) for whom you want to share your report or graph/chart with.
- Click the arrow and select the permission for each user or role. The available options are:
- Can edit and view: The default
- Can view
- Click Add.
Note: Click Save at anytime to view your changes.
Service Cost Modeling Tab
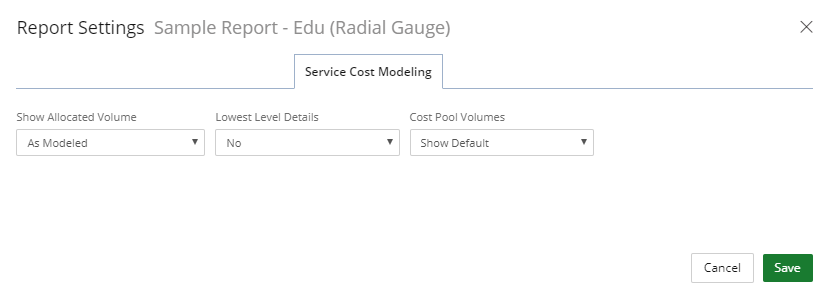
- Show Allocated Volume:
- As Modeled: Displays allocated volumes in a separate column within your graph. This is the default.
- As Uploaded:
This option is only applicable to the Service Cost Modeling data dimension selected when creating the graph. - Lowest Level Details:
- Yes: Displays the lowest level data values in your graph.
- No: This is the default.
- Cost Pool Volumes:
- Show Default: This is the default.
- Show All: Allows you to specify the cost pool volumes within your graph based on one or more units of measure.
Note: This option is only applicable to the Service Cost Modeling data dimension selected when creating a report.
Note: Click Save at anytime to view your changes.
On Page Filters Tab
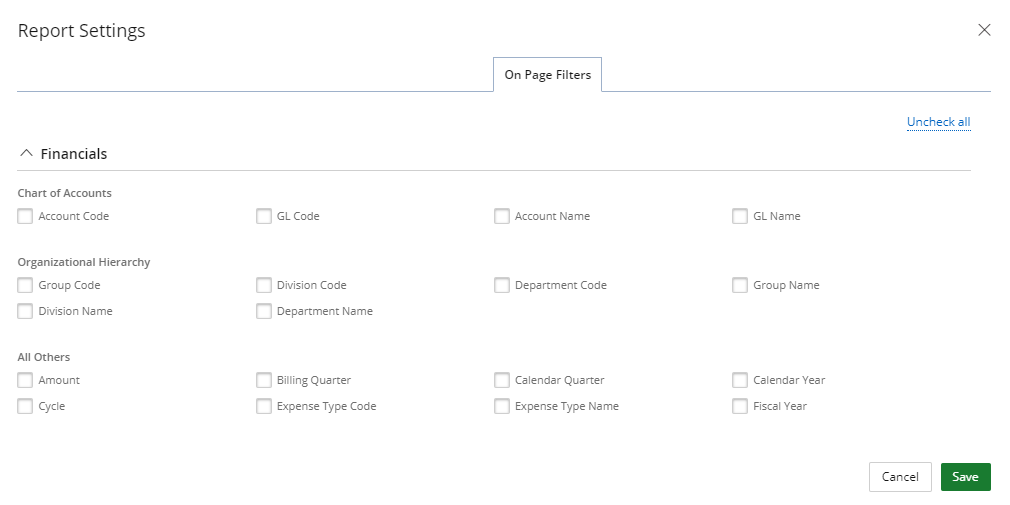
This tab displays all of the fields contained in the data source used to create the report.
- Select the field(s) that you want to filter.
- Click Save.