Settings
Select one or more of the available report settings tabs:
General Tab
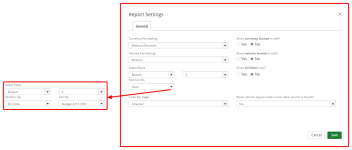
- Select one of the Currency Formatting options:
- Inherited: Selected by default
- With Decimals: 1,000.00
- Without Decimals: 1,000
- Thousands: 100,000.00 or 100,000
- Thousands with decimals: 100.00
- Millions: 1,000,000.00 or 1,000,000
- Millions with decimals: 1.00
- Select one of the Show currency format in title options:
- Yes: Displays the currency format on the report or graph/chart title.
- No: Hides the currency format on the report or graph/chart title.
- Select one of the Volume Formatting options:
- Inherited: Selected by default
- With Decimals: 1,000.00
- Without Decimals: 1,000
- Thousands: 100,000.00 or 100,000
- Thousands with decimals: 100.00
- Millions: 1,000,000.00 or 1,000,000
- Millions with decimals: 1.00
- Select one of the Show volume format in title options:
- Yes: Displays the volume format on the report or graph/chart title.
- No: Hides the volume format on the report or graph/chart title.
- Select the number of records to display in your report from the Select Rows drop-down menu:
- All: Selected by default
- Top
- Bottom
- Select one of the Show All Other row options:
- Yes: Displays the All Others row.
- No: Hides the All Others row.
- In the Partition By drop-down menu, select one of the following:
- None: The report or graph/chart will not be partitioned.
- Select an available field to partition the report or graph/chart, and then in the Sort By field, select a field to use to sort.
- In the Lines Per Page drop-down menu, select the number of lines per page to display in your report or graph/chart: Inherited (selected by default), 5, 10, 20 , 30, 40, 50, 75, or 100.
- In the Reset column layout when a new data column is found? drop-down menu, select Yes or No.
Note: This option is not available when Inherited is selected in the Currency Formatting drop-down menu.
Note: This option is not available when Inherited is selected in the Volume Formatting drop-down menu.
Note: This option is available when Top or Bottom is selected in the Select Rows drop-down menu. This option is not available when a field is selected in the Partition By drop-down menu.
Note: This option is available when Top or Bottom is selected in the Select Rows drop-down menu.
Note: Click Save at anytime to view your changes.
Column Configuration Tab
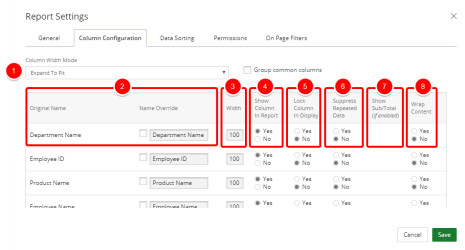
- Column Width Mode: Click one of the following from the drop-down menu:
- Expand To Fit
- Fixed Column Size
- Size Based On Content
- Size Based on Title
- Size Based on Best Fit
- Name Override: Allows you to rename the original column name. Select the checkbox for the column name that you want to change and then type the new column name in the box.
- Width
- Show Column In Report: Allows you do display or hide the selected columns in your report.
- Yes: The column displays. The default.
- No: The column is hidden.
- Lock Column In Display: Allows you to lock or unlock the first column in your report.
- Yes: The column is locked.
- No: The column is unlocked. The default.
- Suppress Repeated Data: Allows you to display or hide columns that contain repeating data.
- Yes: Hide columns that contain repeating data.
- No: Display columns that contain repeating data.
- Show Sub/Total (if enabled):
- Wrap Content: Allows you to wrap text in a column.
- Yes: The text will wrap.
- No: The text will not wrap and may be cut off.
-
Note: Click Save at anytime to view your changes.
Data Sorting Tab
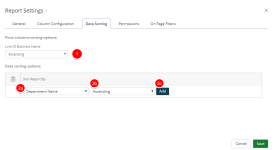
- In the Line of Business Name drop-down box, select how the Pivot columns are to be sorted: Ascending or Descending order.
- Do the following in the Data sorting options section:
- Select an available column field from the available options.
- Select the sorting order: Ascending or Desending.
- Click Add to add a new line item.
Note: Click Save at anytime to view your changes.
Version Override Tab
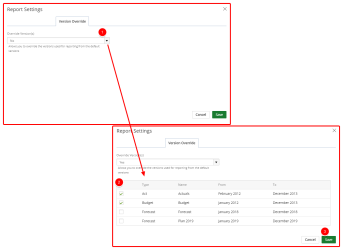
Override the versions used for reporting from the default versions.
- Select Yes from the Overrride Version(s) drop-down menu. A list of default versions display.
- Select the checkbox next to one or more default versions on which you want to report.
- Click Save.
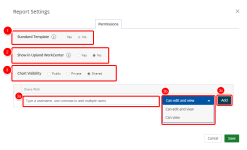
Permissions Tab
- Standard Template: Select whether or not to use the standard template.
- Show in Upland WorkCenter: Select whether or not to display the report or graph/chart in Upland WorkCenter.
- Yes: The report is available in Upland WorkCenter.
- No: The report is not available in Upland Workcenter.
- Report/Chart Visibility: Select one of the following:
- Public: Allows your report or graph/chart to be viewed and edited by all users. By default, this option is selected.
- Private: Allows your report or graph/chart to be viewed and edited by you only.
- Share: Allows you to set your report or graph/chart to be viewed by a specific user(s) or role(s) and give permissions. The Shared With field displays:
- Click the Select a value field and select the user(s) or role(s) for whom you want to share your report or graph/chart with.
- Click the arrow and select the permission for each user or role. The available options are:
- Can edit and view: The default
- Can view
- Click Add.
Note: Click Save at anytime to view your changes.
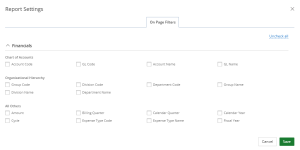
On-Page Filters Tab
This tab displays all of the fields contained in the data source used to create the report.
- Select the field(s) that you want to filter.
- Click Save.
