Create a Pivot Table
- Click Create on the Main Menu bar.
- Select Report from the menu. A list of available data sources displays.
Note: Data sources in this step are provided for example only. Your Data sources will depend on the modules licensed and the permissions granted. For more information, see Data Sources/Views.
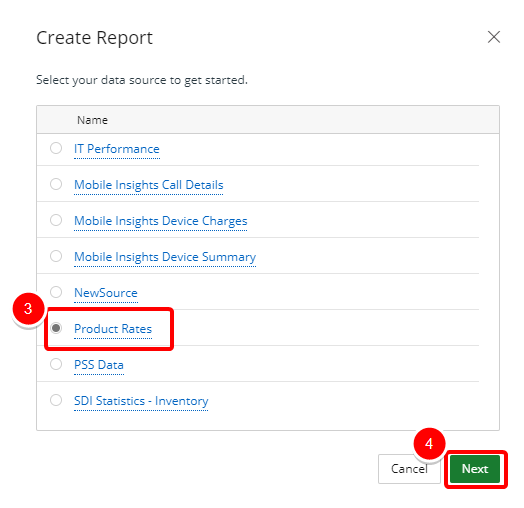
- Select the data source that you want to use for your report or graph/chart from the list.
- Click Next. The Report Layout page displays.
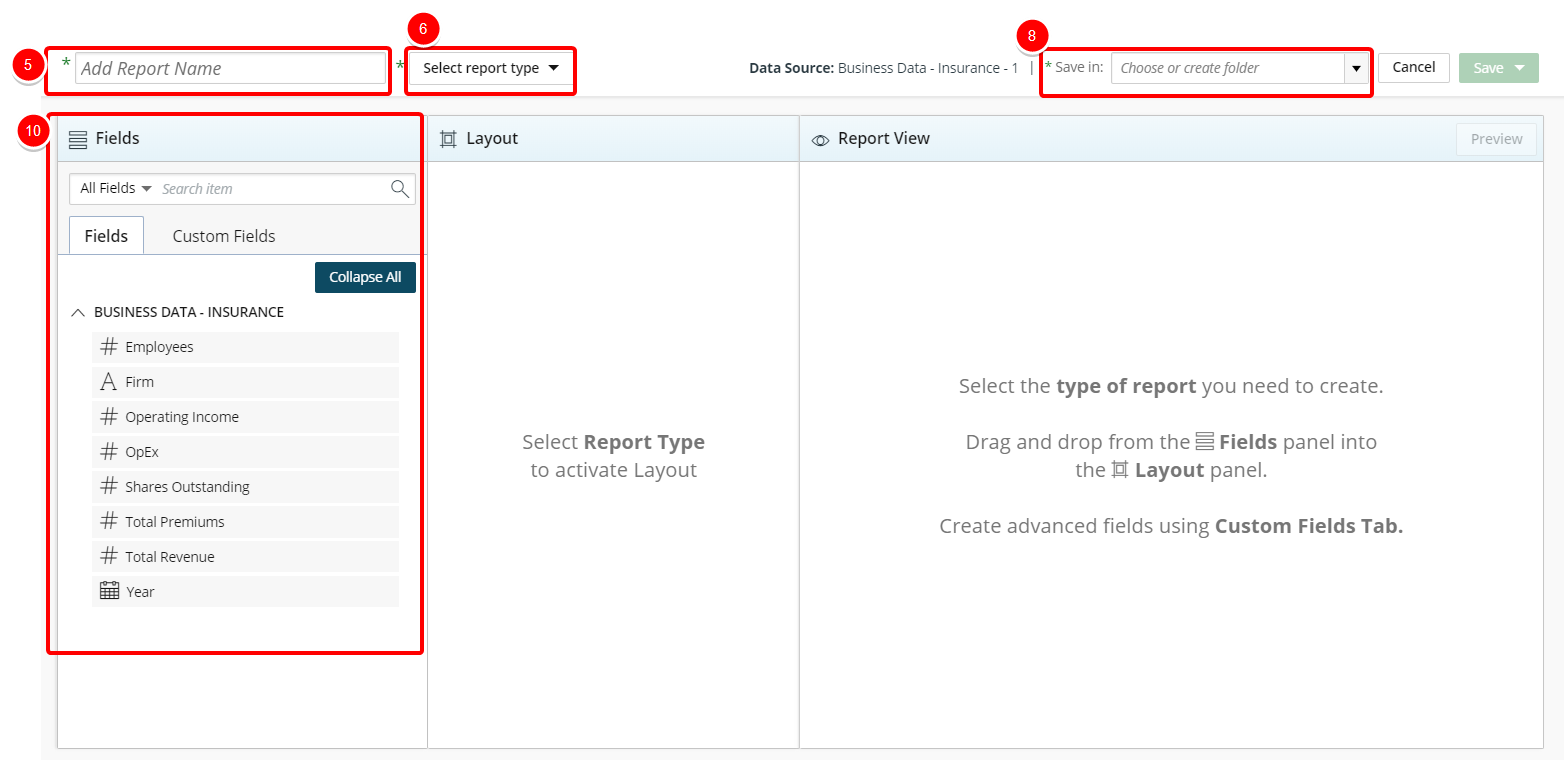
- Click Add report name box and type the name of your graph/chart.
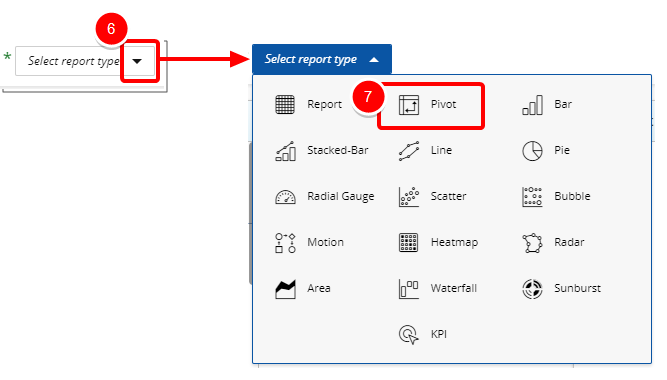
- Click the Select report type drop-down arrow.
- Select Pivot from the list of available report types.
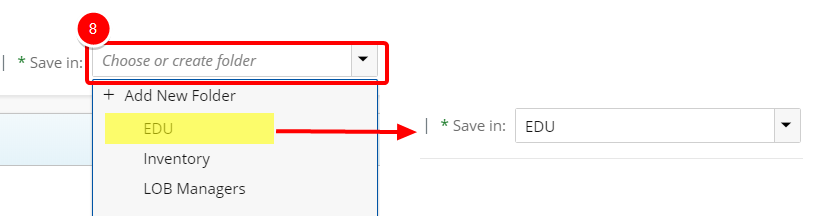
- Click the Save in drop-down arrow and select one of the following:
- An existing folder from the list where you want to save the report or graph/chart.
- Add New Folder to create a new folder where your report or graph/chart will be saved. See Create a Folder.
Note: Type values in this box to filter and find the folder where your report or graph/chart will be saved.
- Do the following to add fields to the report:
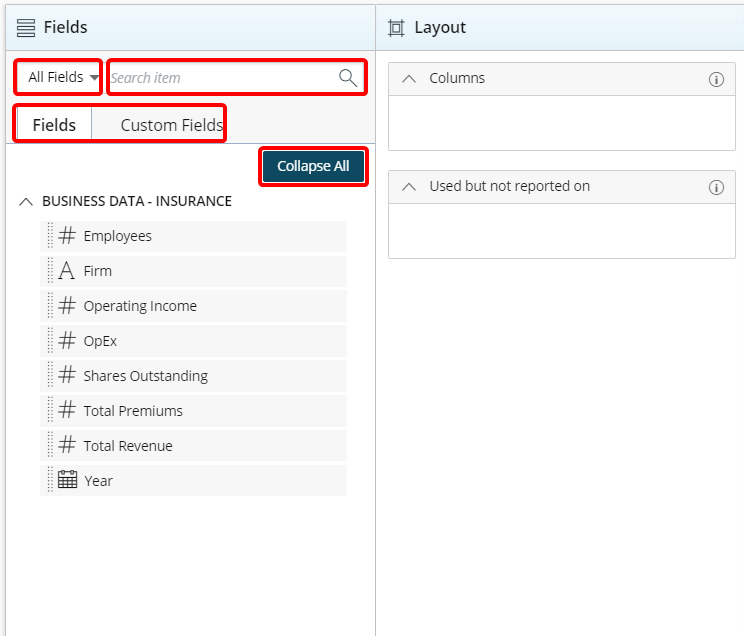
- Select the desired filter to apply to the list of available fields. The available options are:
- All Fields
- Dimensions
- Measures
- Date
- Start typing in the Search item box to begin searching for available fields.
- Click Expand All or Collapse All to view or hide all available options in order to easily narrow down on the desired field(s).
- Optional: Click Custom Fields to create a custom field.
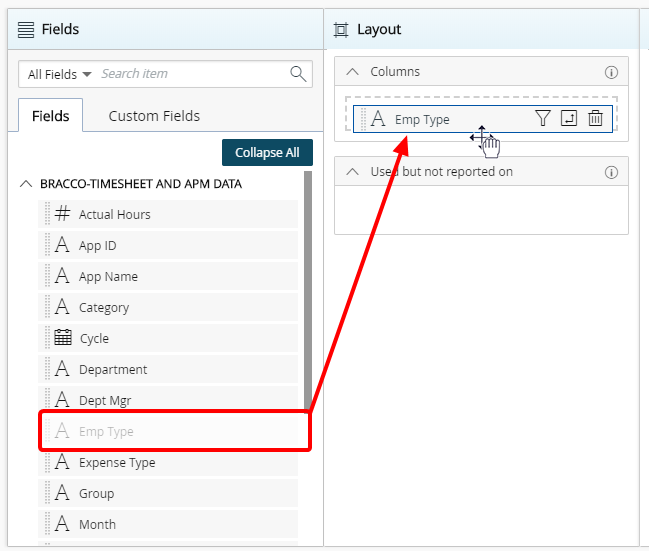
- Drag and drop the fields to add to the report from the Fields list to the Layout section.
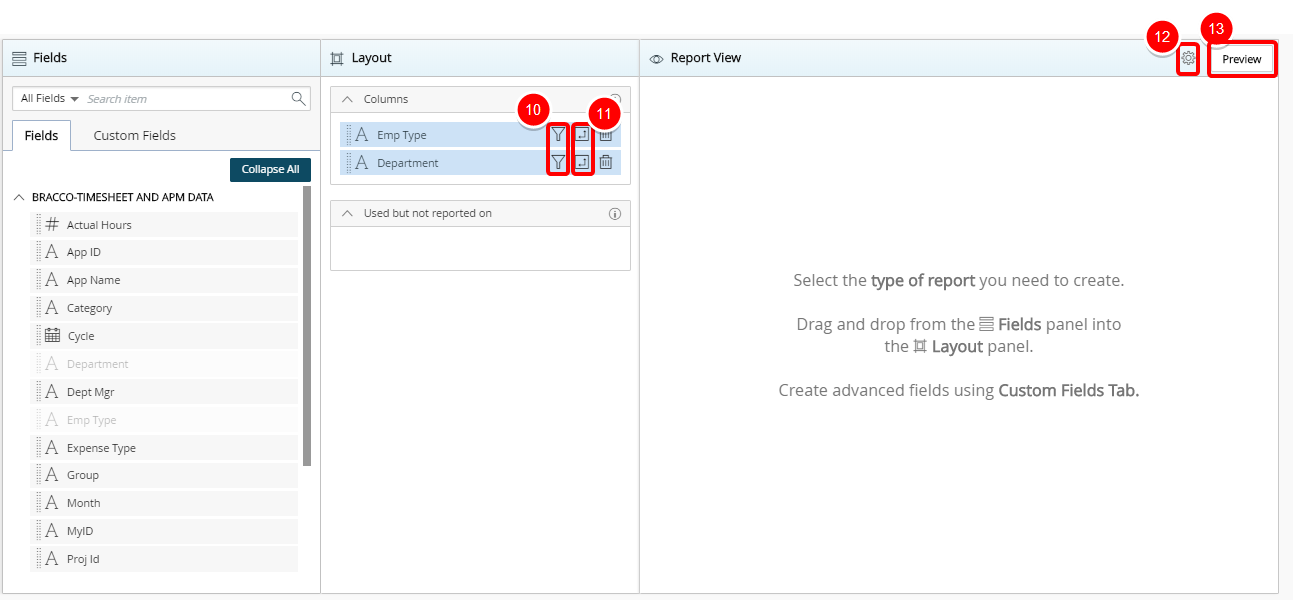
- Click
 to add a filter. For more information, see Add a Filter.
 - Optional: Click
 to add a pivot. For more information, see Add a Pivot.
 - Optional: Click
 to view the available Report Settings options:
 - Show Subtotal: By default, None is selected which means the report will not display a subtotal:
- First: A subtotal will display in the first column of your report.
- All: A subtotal will display for every numerical column of your report.
- Show Total: By default, Yes is selected. If you select No, a total will not be displayed in your report.
- Optional: Click Preview to preview your report. Your report displays in View Mode.
 To send the report or graph/chart offline in an email.
 To stop loading and abort the report or graph/chart.
 To continue waiting and view the report or graph/chart.
- Click Save to open the Save context menu
- Select one of the available options:
- Save: Selecting this option will save the report without exiting the report edit page.
- Save as copy: Selecting this option will save a copy of the report. You will need to rename the report in the Navigation Menu.
- Save & Close: Selecting this option will save the report and close the report edit page. The report will then run.
- Save & send by email: Selecting this option will save the report and close the report edit page. A modal window will then give you the options to send the report. For more information, see Email a Report.
- Save & Create new: Selecting this option will save the report and close the report edit page giving you the option to create a new report.
For more information on how to create and use Custom Fields, see Create and Use Custom Fields.
Note: If you create a custom field, you must use it in your report. Otherwise, you will not be able to save the report.
Note: The elements in the Layout section change depending on the requirements of the Report Type you are creating.
Note: You must add at least one filter.
Note: Click Save to save your changes or Cancel to return to your Report Layout page.
Note: You can preview your report at any time by clicking on the Preview button. No Data Available displays when there is no data retrieved/found.
Note: The following message displays when a report or graph/chart takes too long to render:

Click one of the following: