Pie settings
You can customize a new or existing pie chart using the available setting options.
-
Open the Main Menu bar and click
 .
. -
Click one of the following:
-
Settings: available only to the Administrator or the chart creator.
-
My Settings: available to users with access rights to review the chart.
-
Settings
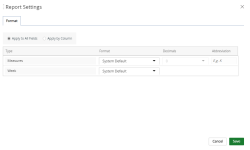
Select one or more of the available report settings tabs:
Format tab
Use this tab to apply numeric and week formatting to the chart.

Select one of the following:
- Apply to All Fields: To apply the selected formatting to all numeric and/or week fields in the report.
- Type: Displays the type of fields that can be formatted:
Measures: Selections made in this row will be applied to numeric fields only.
- Format: Select one of the following formatting option from the drop-down menu:
- System Default: Displays the numeric fields using the default system preferences set by your Administrator.
- Thousands: To format the numeric fields that have values in thousands.
- Millions: To format the numeric fields that have values in millions.
- Decimals: Select the number of digits to display after the decimal for numeric fields that have values in thousands and/or millions. For example, if you select Thousands and then type 3 in this field, the numeric fields that have values in thousands will display as XXX.XXX.
- Abbreviation: Type the abbreviation for the numeric fields that have values in thousands and/or millions. For example, if you select Millions and then type M in this field, the numeric fields that have values in millions will display as XXXM.
- Format: Select one of the following formatting option from the drop-down menu:
- Week: Selections made in this row will be applied to week fields only.
- Format: Select one of the following week formats:
- System Default: Displays the week using the default system preferences set by your Administrator.
- Week of Jan 1 20XX
- Week of Jan 1
- 20XX W01
- Format: Select one of the following week formats:
- Type: Displays the type of fields that can be formatted:
-
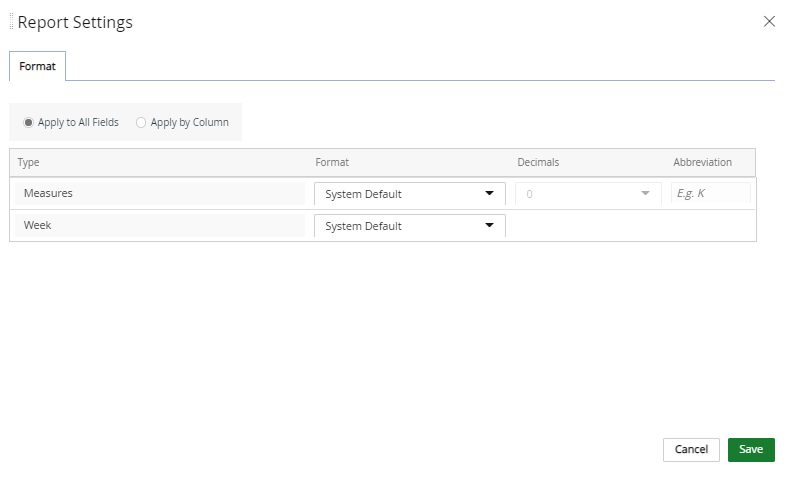
Apply By Column: To apply the selected formatting to columns that contain numeric and week fields.
- Column: Displays the columns in the report that can be formatted.
- For numeric columns:
- Format: Select one of the following formatting option from the drop-down menu:
- System Default: Displays the numeric fields using the default system preferences set by your Administrator.
- Thousands: To format the numeric fields that have values in thousands.
- Millions: To format the numeric fields that have values in millions.
- Decimals: Select the number of digits to display after the decimal for numeric fields that have values in thousands and/or millions. For example, if you select Thousands and then type 3 in this field, the numeric fields that have values in thousands will display as XXX.XXX.
- Abbreviation: Type the abbreviation for the numeric fields that have values in thousands and/or millions. For example, if you select Millions and then type M in this field, the numeric fields that have values in millions will display as XXXM.
- Format: Select one of the following formatting option from the drop-down menu:
- For week columns:
- Format: Select one of the following week formats:
- System Default: Displays the week using the default system preferences set by your Administrator.
- Week of Jan 1 20XX
- Week of Jan 1
- 20XX W01
- Format: Select one of the following week formats:
Pie tab
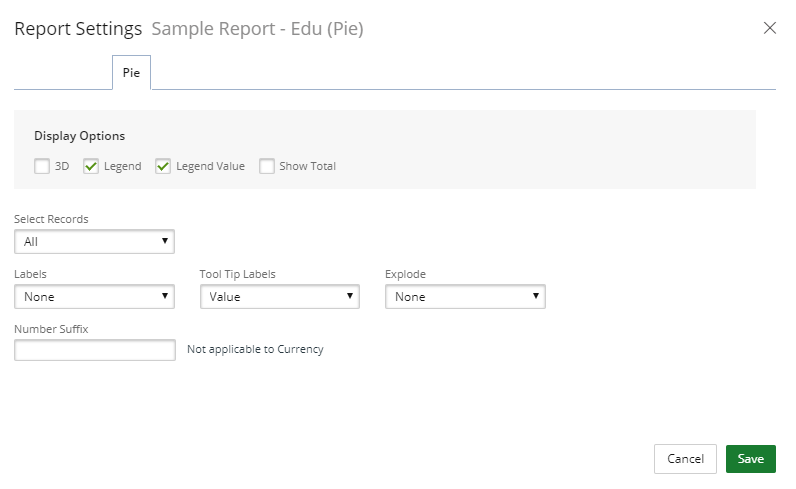
- Display Options: Select one or more of the desired Display Options. Available options are:
- 3D: Select this checkbox to display the chart in 3D.
- Legend: Select the checkbox to display the legend on the chart. Clear the checkbox to hide the legend. By default, Legend is selected.
- Legend Value: Select the checkbox to display the text and numeric legend values on the chart. Clear the checkbox to hide the legend values. By default, Legend Value is selected.
- Show Total: Select this checkbox to display the grand total within the upper right corner of the chart.
- Select Records: Select the records to display on the chart:
- All: Displays all records on the chart. This is the default.
- Top: Displays the top X number of records on the chart. Click the drop-down arrow next to the box to select the number of top records to display.
- Bottom: Displays the bottom X number of records on the chart. Click the drop-down arrow next to the box to select the number of bottom records to display.
- Labels: Select how to display the labels on the chart:
- None: Labels are hidden. This is the default.
- Value: Labels values display numerically.
- Percentage: Labels values display as percentages.
- Tool Tip Labels: Available options are: Value, Percentage and Value & Percentage. By Default Value is selected.
- Explode: Select how to explode the chart:
- None: This is the default.
- Largest Part
- All
- Number Suffix: Type a number or text value to append front of the vertical numeric values on the chart. Number Suffix does not apply to Currency.
Display tab
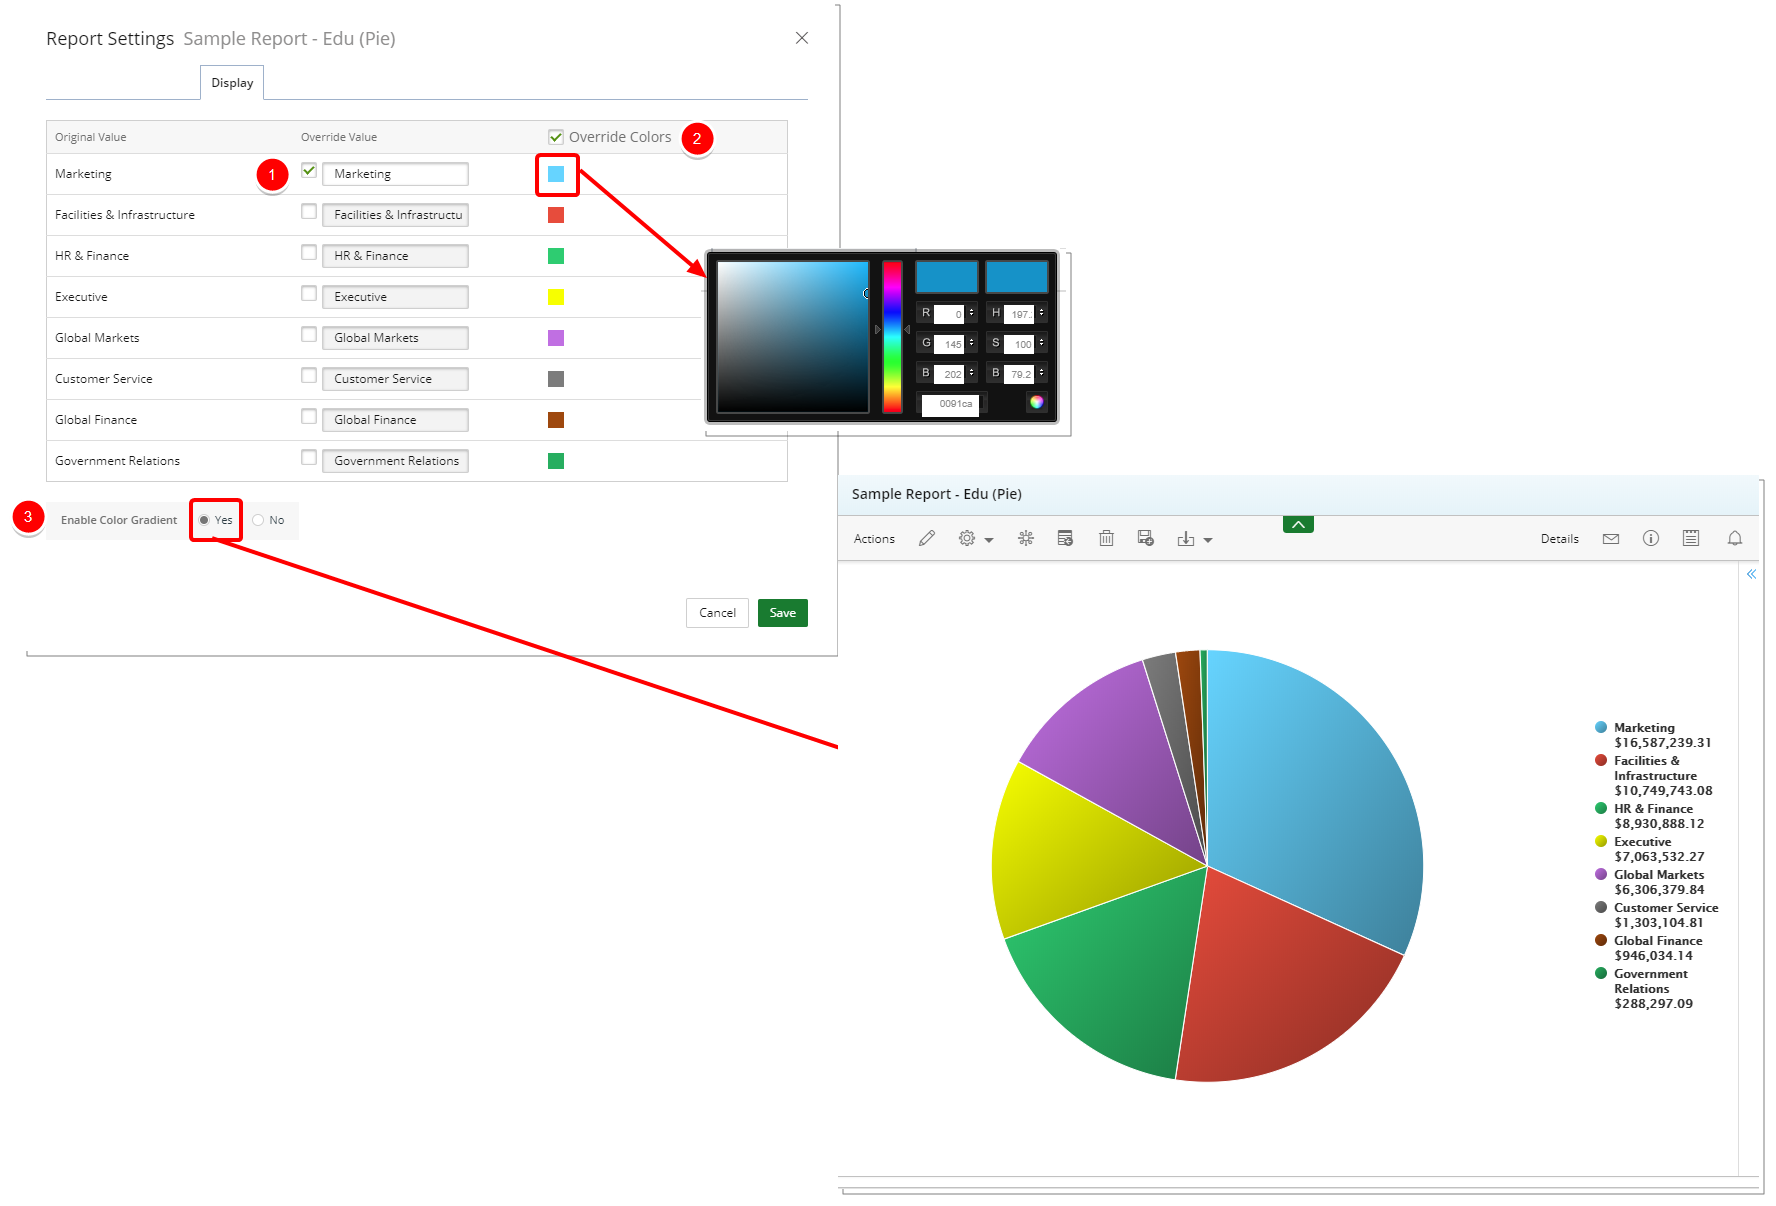
- Original Label Value: Select the checkbox next to the label you want to override and type the new label in the Override Value box.
- Override Colors: Use this checkbox to override the colors on the chart. Select the checkbox and then click on the color and make a new color selection.
- Enable Color Gradient: Select one of the following:
- Yes: To display the colors on the chart in gradient instead of a solid color.
- No: To display the colors on the chart in a solid color.
Permissions tab
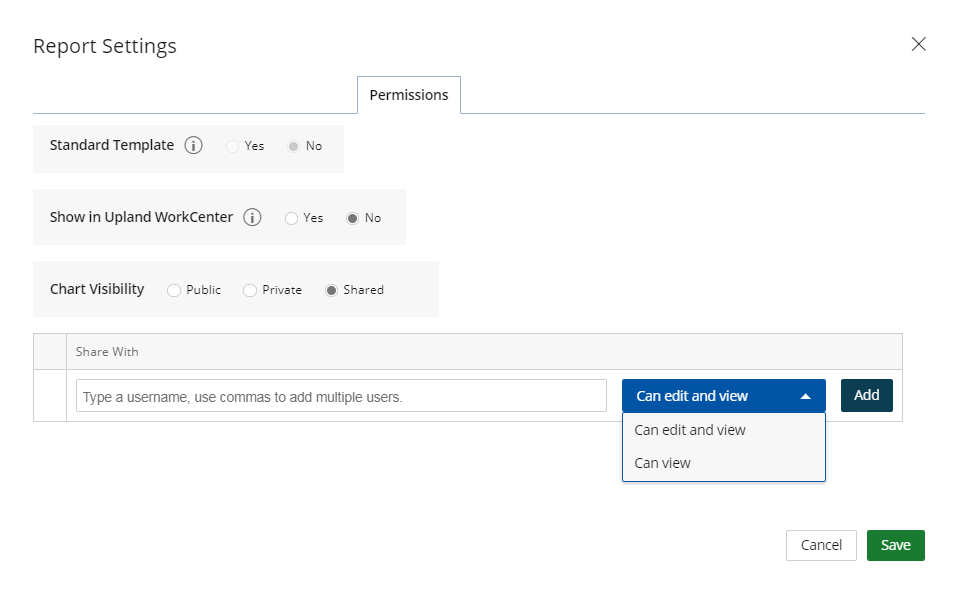
- Standard Template: Select whether or not to use the standard template.
- Show in Upland WorkCenter: Select whether or not to display the report or graph/chart in Upland WorkCenter.
- Yes: The report is available in Upland WorkCenter.
- No: The report is not available in Upland Workcenter.
- Report/Chart Visibility: Select one of the following:
- Public: Allows your report or graph/chart to be viewed and edited by all users. By default, this option is selected.
- Private: Allows your report or graph/chart to be viewed and edited by you only.
- Share: Allows you to set your report or graph/chart to be viewed by a specific user(s) or role(s) and give permissions. The Shared With field displays:
- Click the Select a value field and select the user(s) or user group(s) for whom you want to share your report or graph/chart with.
- Click the arrow and select the permission for each user or role. The available options are:
- Can edit and view: The default
- Can view
- Click Add.
Note: The roles display as follows: User Group Label (User Group Name).
Note: Click Save at anytime to view your changes.
My Settings
Caution: The options available to you on the My Settings dialog box overwrite those that were set on the Settings dialog box by the Report Owner.
General tab
Select how numbers should be displayed on your graph/chart:
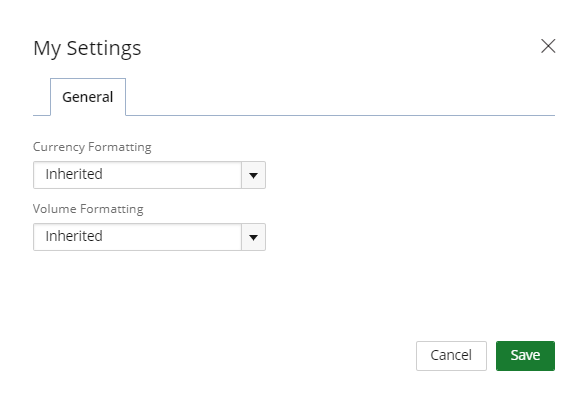
- Select one of the Currency Formatting options:
- Inherited: Selected by default
- With Decimals: 1,000.00
- Without Decimals: 1,000
- Thousands: 100,000.00 or 100,000
- Thousands with decimals: 100.00
- Millions: 1,000,000.00 or 1,000,000
- Millions with decimals: 1.00
- Select one of the Volume Formatting options:
- Inherited: Selected by default
- With Decimals: 1,000.00
- Without Decimals: 1,000
- Thousands: 100,000.00 or 100,000
- Thousands with decimals: 100.00
- Millions: 1,000,000.00 or 1,000,000
- Millions with decimals: 1.00
- Click Save settings to save your changes.