Pivot settings
Select one or more of the available report settings tabs:
Format tab
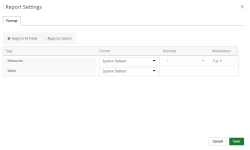
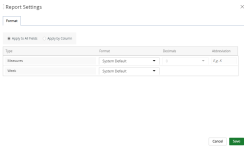
Use this tab to apply numeric and week formatting to the chart.
Select one of the following:
- Apply to All Fields: To apply the selected formatting to all numeric and/or week fields in the report.
- Type: Displays the type of fields that can be formatted:
Measures: Selections made in this row will be applied to numeric fields only.
- Format: Select one of the following formatting option from the drop-down menu:
- System Default: Displays the numeric fields using the default system preferences set by your Administrator.
- Thousands: To format the numeric fields that have values in thousands.
- Millions: To format the numeric fields that have values in millions.
- Decimals: Select the number of digits to display after the decimal for numeric fields that have values in thousands and/or millions. For example, if you select Thousands and then type 3 in this field, the numeric fields that have values in thousands will display as XXX.XXX.
- Abbreviation: Type the abbreviation for the numeric fields that have values in thousands and/or millions. For example, if you select Millions and then type M in this field, the numeric fields that have values in millions will display as XXXM.
- Format: Select one of the following formatting option from the drop-down menu:
- Week: Selections made in this row will be applied to week fields only.
- Format: Select one of the following week formats:
- System Default: Displays the week using the default system preferences set by your Administrator.
- Week of Jan 1 20XX
- Week of Jan 1
- 20XX W01
- Format: Select one of the following week formats:
- Type: Displays the type of fields that can be formatted:
-
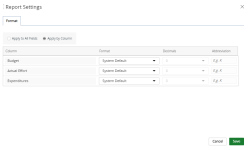
Apply By Column: To apply the selected formatting to columns that contain numeric and week fields.
- Column: Displays the columns in the report that can be formatted.
- For numeric columns:
- Format: Select one of the following formatting option from the drop-down menu:
- System Default: Displays the numeric fields using the default system preferences set by your Administrator.
- Thousands: To format the numeric fields that have values in thousands.
- Millions: To format the numeric fields that have values in millions.
- Decimals: Select the number of digits to display after the decimal for numeric fields that have values in thousands and/or millions. For example, if you select Thousands and then type 3 in this field, the numeric fields that have values in thousands will display as XXX.XXX.
- Abbreviation: Type the abbreviation for the numeric fields that have values in thousands and/or millions. For example, if you select Millions and then type M in this field, the numeric fields that have values in millions will display as XXXM.
- Format: Select one of the following formatting option from the drop-down menu:
- For week columns:
- Format: Select one of the following week formats:
- System Default: Displays the week using the default system preferences set by your Administrator.
- Week of Jan 1 20XX
- Week of Jan 1
- 20XX W01
- Format: Select one of the following week formats:
Rows tab
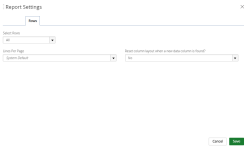
Use this tab to select specific data to display and/or format the amount of rows of records to display per report page.
-
Select Rows: To display records based on the specified sort.
- All: To display all records.
-
Top: To display the top number of records. In the second field, select the number of records to display from the drop-down menu. For example, display the top 10 most expensive project.
Note: The Show All Other row option displays when you don't add a partition. Select Yes to display the total for the all fields. Select No to display the total for only the fields that display.
-
Bottom: To display the bottom number of records. In the second field, select the number of records to display from the drop-down menu. For example, display the bottom 5 least expensive products.
Note: The Show All Other row option displays when you don't add a partition. Select Yes to display the total for the all fields. Select No to display the total for only the fields that display.
-
Show All Other row: This option displays when you don't add a partition. Select one of the following:
-
Yes: Displays the total for the all fields.
-
No: Displays the total for only the fields that display.
-
-
Partition By: Select the column on which you want to sort on. For example, display the top most expensive products in the X column.
-
Sort By: Select the field on which you want to sort on.
-
-
Lines Per Page: Select the user's default number of pages of records to display on UA pages from the drop-down menu.
Note: System Default uses the default system preferences set by your Administrator.
-
Reset column layout when a new data column is found: Select one of the following:
-
Yes: When the report is edited, the column positioning is not changed.
-
No: When the report is edited, the column positioning is changed to accommodate the new layout.
-
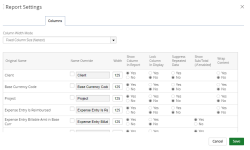
Columns tab
Use this tab to format columns.
-
Column Width Mode: Click one of the following from the drop-down menu:
-
Fixed Column Size
-
Expand To Fit
-
Size Based on Title
-
Size Based on Best Fit
-
-
Name Override: Select the checkbox for the column name that you want to change and then type the new column name in the box to rename the original column name.
-
Width: Type a new size to resize the column width.
-
Show Column In Report: Select to display or hide the selected columns in your report:
-
Yes: The column displays. The default.
-
No: The column is hidden.
-
-
Lock Column In Display: Select to lock or unlock the first column in your report:
-
Yes: The column is locked.
-
No: The column is unlocked. The default.
-
-
Suppress Repeated Data: Select to display or hide columns that contain repeating data:
-
Yes: Hide columns that contain repeating data.
-
No: Display columns that contain repeating data.
-
-
Show Sub/Total (if enabled): Select to display or hide the subtotal of the column:
- Yes: Displays the subtotal in columns.
- No: Hides the subtotal in columns.
-
Wrap Content: Select how to format longer text in a column:
-
Yes: The text will wrap. Longer text will fully display in a cell without it being cut off.
-
No: The text will not wrap and may be cut off.
-
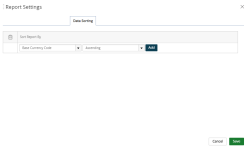
Data Sorting tab
Use this tab to apply data sorting to the report.
Sort Report By
- Select an available column field from the available options on which to sort on.
- Select the sorting order: Ascending or Desending.
- Click Add to add a new sort.
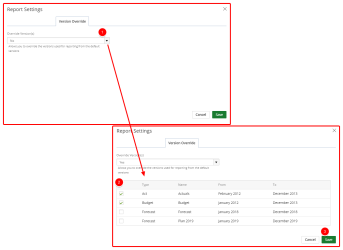
Version Override tab
Override the versions used for reporting from the default versions.
- Select Yes from the Override Version(s) drop-down menu. A list of default versions display.
- Select the checkbox next to one or more default versions on which you want to report.
- Click Save.
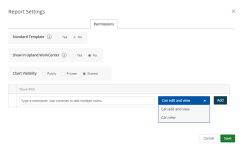
Permissions tab
- Standard Template: Select whether or not to use the standard template.
- Show in Upland WorkCenter: Select whether or not to display the report or graph/chart in Upland WorkCenter.
- Yes: The report is available in Upland WorkCenter.
- No: The report is not available in Upland Workcenter.
- Report/Chart Visibility: Select one of the following:
- Public: Allows your report or graph/chart to be viewed and edited by all users. By default, this option is selected.
- Private: Allows your report or graph/chart to be viewed by you only.
- Share: Allows you to set your report or graph/chart to be viewed by a specific user(s) or role(s) and give permissions. The Shared With field displays:
- Click the Select a value field and select the user(s) or user group(s) for whom you want to share your report or graph/chart with.
- Click the arrow and select the permission for each user or role. The available options are:
- Can edit and view: The default
- Can view
- Click Add.
Note: The roles display as follows: User Group Label (User Group Name).
Note: Click Save at anytime to view your changes.
