The Server Dashboard is a WebApps tool that Administrators can use to monitor the status of their server configuration in a live environment. It monitors and displays a server’s services, connectors, queues, compose engine states and more in a color-coded format. Administrators can customize the Server Dashboard view by modifying default test criteria or creating new test criteria specific to their server configurations. In addition, users typically fulfilling an Administrator or Power User role can view the Server Dashboard based on specific group permissions granted while other groups cannot.
What is monitored
The following list shows what is monitored and will appear on the Server Dashboard.
|
Server Item |
Monitoring and/or Display Details |
|---|---|
|
Services |
Services in a Started state |
|
Connectors |
Connectors in an Enabled state |
|
Components |
Components above threshold |
|
Compose Engine |
Compose engine state |
|
Local Drive Size |
Local drive size is within threshold limits Upland AccuRoute and Compose servers |
|
Job Failure Rate |
Job failure rate during a specific period of time |
|
Processing Time |
Average processing time for fax, email or folder destination messages over the past 24 hours |
|
Network Folders |
Network folders threshold based on a specific time span or volume of documents in a folder |
|
Server Feature |
Monitoring and/or Simulation Details |
|
IIS App Pools |
IIS App Pools in a started state for each connected IIS Server and verified when the web URL is successful |
|
LDAP Lookup Simulator |
User Account LDAP lookup based on server access and display time |
Before you begin
The following installations are required and must be completed before you can set up the Server Dashboard.
-
Server
-
Server Monitor
- WebApps
See the Server and Client Installation Guides for more information.
Note: Device Client installation with device simulation is optional and can be configured to work with the Server Dashboard. Contact Technical Support for further assistance.
Administrators must complete the following tasks.
Server Dashboard at a Glance
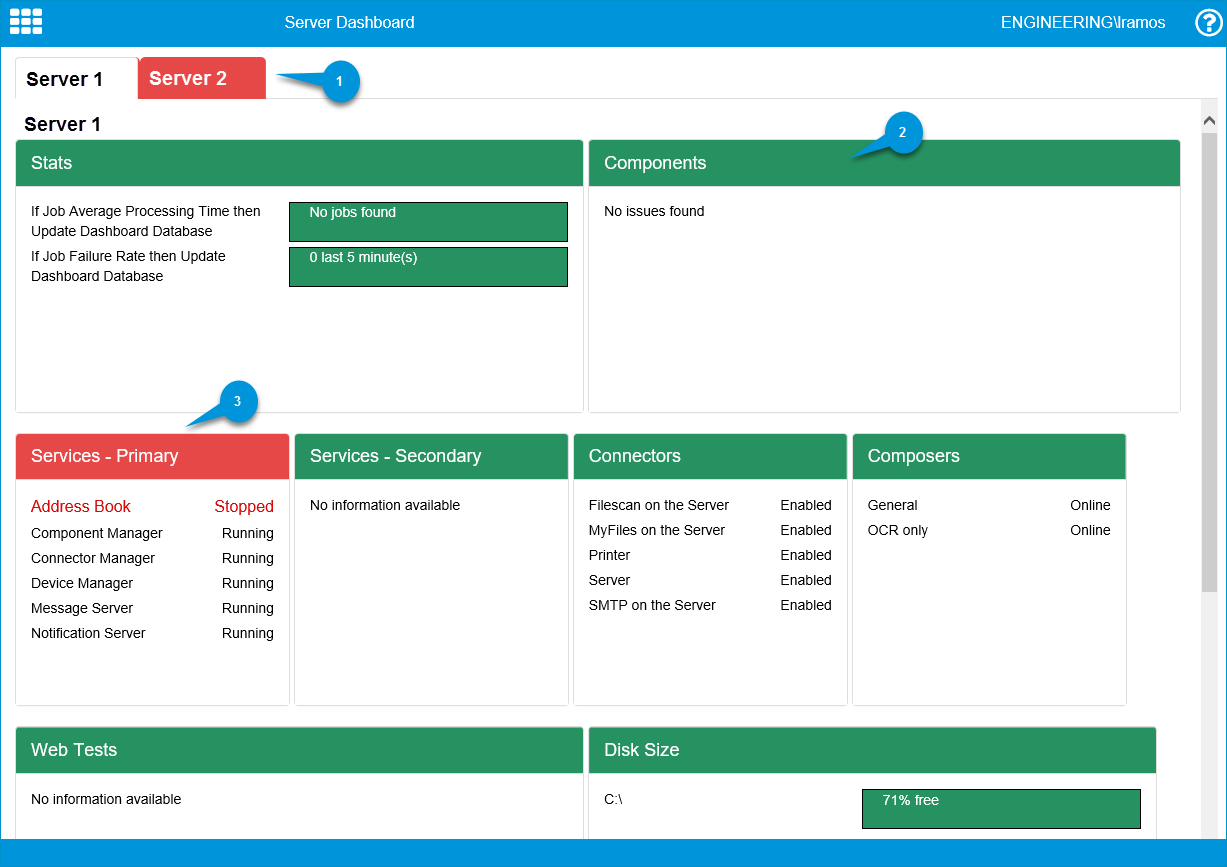
|
Server Dashboard Legend |
Description |
|---|---|
|
1. Server Dashboard tabs |
Use to select and view multiple Server Dashboards if multiple servers are part of your workflow configuration. Note: The tab and/or border changes to a red color if the server is experiencing any issues. |
|
2. Server Dashboard widgets |
Use to view server activity and server-related information. Note: The information displayed in the widgets is based on the Server Dashboard default or custom test criteria created. |
|
3. Server Dashboard color-coded format |
Use the following colors to view server status and determine appropriate actions to resolve issues.
|
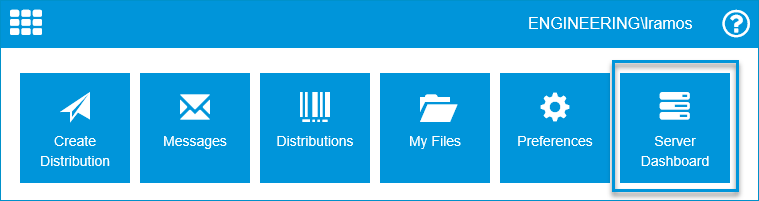
Accessing Server Dashboard
You can access the Server Dashboard by opening the WebApps application.
To access the Server Dashboard
-
Open your browser.
-
Type or paste your specific WebApps URL in the browser’s address bar.
-
Press Enter. The WebApps application appears.
-
Select the Server Dashboard tile. The Server Dashboard appears.
See the WebApps > Server Dashboard tile example below.
See also