Administrators can set up the Server Dashboard by creating a WebApps Dashboard profile, adding the appropriate profile group permission, and configuring the Server Monitor to use default or new test criteria. Test criteria are rules used to test server activity. The test criteria results are shown on the Server Dashboard.
Setting up the Server Dashboard includes the following tasks.
Note: You can modify the default test criteria or create new test criteria to meet your company’s server monitoring requirements.
Creating a WebApps Dashboard Profile
You can create a WebApps dashboard profile by using Configuration > WebApps on the Server Administrator tree.
Note: You can modify a current WebApps profile; for example, Admin instead of creating a new profile.
To create a WebApps dashboard profile
-
Start the Server Administrator.
-
Select and expand Configuration, if necessary.
-
Right-click WebApps . The Properties shortcut menu appears.
-
Select New > Profile. The Dashboard Profile Properties dialog box appears.
-
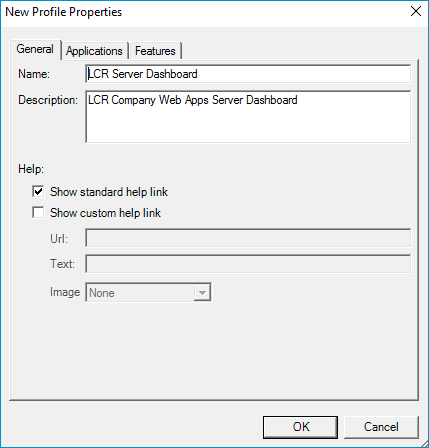
Type a profile name and description in the Name and Description boxes.
-
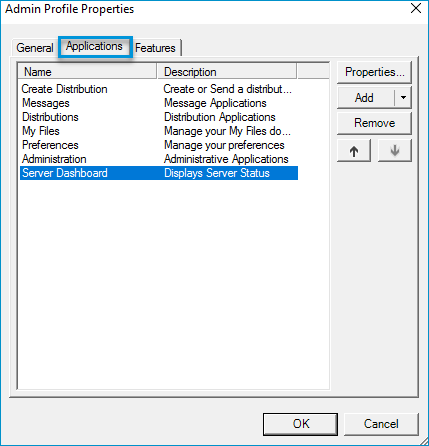
Select the Applications tab.
-
Click Add. The Applications menu appears.
-
Select Administration > Server Dashboard.
-
Select the Database tab and ensure the Database connection information is accurate.
-
Select the Server Groups tab.
-
Click Add.
-
Type a display name and primary server name in the Display Name and Primary Server boxes.
-
Click OK on the Server Group Form dialog box.
-
Ensure the Server information is accurate and click OK on the Server Dashboard Application Properties dialog box.
-
Click OK on the New Profile Properties dialog box.
See the New Profile Properties > General and Applications dialog box examples below.
|
|
Applying the WebApps Profile Group Permission
You can apply the WebApps profile group permission by using Configuration > Groups on the Server Administrator tree.
Note: You can create new or modify a current group.
To create a new group and apply the WebApps profile group permission
-
Start the Server Administrator.
-
Select and expand Configuration, if necessary.
-
Right-click Groups. The Properties shortcut menu appears.
-
Select New > Group. The Group Properties dialog box appears.
-
Type a group name and description in the Name and Description boxes.
-
Go to the Members section and click Add.
-
Type the group name (from Active Directory Users and Computers) in the Enter the group names…. box.
-
Click Check Names.
-
Click Finish.
-
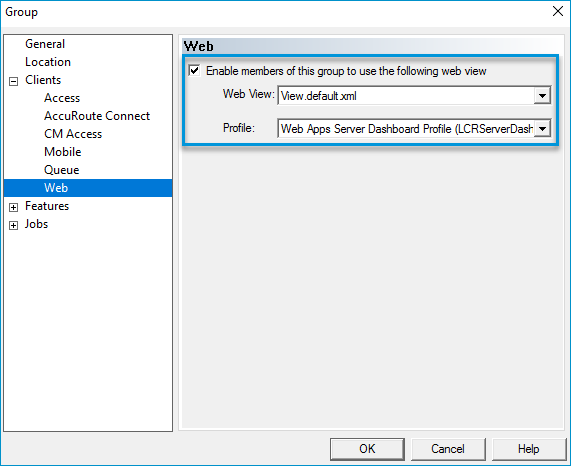
In the left pane, expand Clients and select Web.
-
Select the Enable members of this group…. check box.
-
Select the appropriate profile on the Profile drop-down list.
-
Click OK.
See the Group Properties dialog box with the WebApps profile group permission example below.
Configuring the Server Monitor
You can use the Server Monitor to specify the following Server Dashboard parameters.
-
Identify sender and recipient of email messages
-
Choose to send email reports or update the Server Dashboard when test failures occur.
-
Review DSN information.
-
Modify default or create new test criteria
After configuring the Server Monitor, you are provided with a series of default test criteria. The results based on the test criteria will appear on the Server Dashboard.
To configure the server monitor
-
Go to the Server Monitor installation directory and select ServerMonitor.msc.
-
Open the Server Monitor MMC.
-
Right-click on a blank area in the Server Monitor MMC details pane. The Properties shortcut menu appears.
-
Select Add Server.
-
Type the server name or IP address in the Network Address box.
Note: Use the server name or IP address specified in the WebApps Dashboard Profile > Primary Server box. The information in the Server Monitor and the WebApps dashboard profile must be the same.
-
Click OK. The Default Test Criteria dialog box appears.
-
Type a sender and recipient email address in the From and To boxes.
-
Select the Update the Dashboard database…. option.
-
Ensure the DSN information is accurate in the DSN box.
-
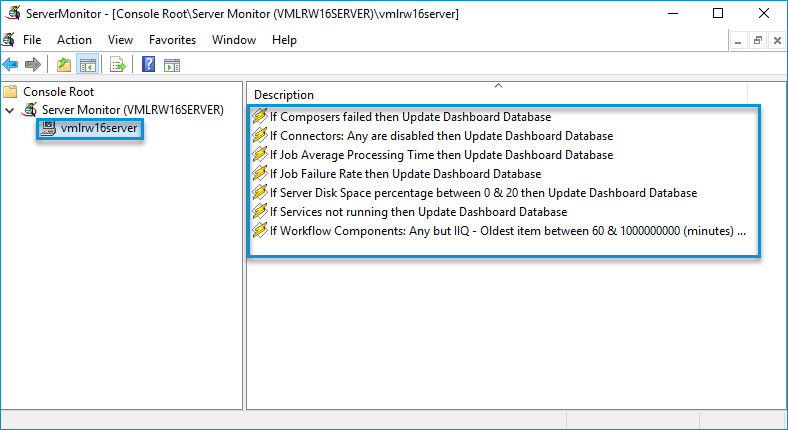
Click Finish. The Default Test Criteria appears in the Server Monitor details pane.
See the Server Monitor MMC with the default test criteria example below.
Modifying default or creating new test criteria
You can modify default or create new test criteria to address your company’s server monitoring requirements by using the Server Monitor.
Note: There may be a slight delay in a Server Dashboard automatic refresh whenever changes are made to the Server Dashboard parameters and its test criteria.
Modifying default test criteria
To modify default test criteria
-
Open the Server Monitor MMC and expand the tree, if necessary.
-
Select the appropriate server. The default test criteria appear in the details pane.
-
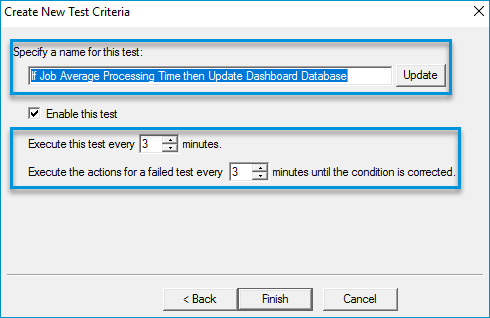
Select a test criterion. The Create New Test Criteria wizard appears with a description of the test or default settings.
-
Use the wizard to modify the test criteria.
-
Click Finish.
You can use the default test criteria to create new test criteria. Simply, rename the default test criteria and update. This allows you to have both the default and new test criteria.
See the Create New Test Criteria wizard example below.
To create test criteria
-
Open the Server Monitor MMC and expand the tree, if necessary.
-
Right-click on the appropriate server name. The Properties shortcut menu appears.
-
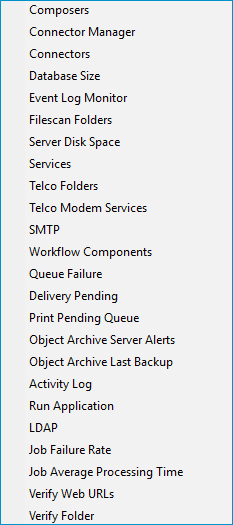
Select New and one of the test criteria options; for example, Database Size.
-
Use the wizard to specify your test criteria parameters.
-
Click Finish.
See the new Test Criteria options example below.
Refreshing the Server Dashboard
The Server Dashboard is refreshed automatically based on server activity fluctuations. You can manually refresh the Server Dashboard by using the browser’s Refresh icon, if necessary.
Note: There may be a slight delay in a Server Dashboard automatic refresh whenever changes are made to the Server Dashboard parameters and its test criteria. This includes adding, deleting, and modifying test criteria. The current Server Dashboard information is removed and starts over causing the slight delay.
See also