The Server Dashboard is a
What is monitored
Expand to view more information.
|
Server Item |
Monitoring and/or Display Details |
|---|---|
|
Services |
Services in a Started state |
|
Connectors |
Connectors in an Enabled state |
|
Components |
Components above threshold |
|
Compose Engine |
Compose engine state |
|
Local Drive Size |
Local drive size is within threshold limits Upland AccuRoute and Compose servers |
|
Job Failure Rate |
Job failure rate during a specific period of time |
|
Processing Time |
Average processing time for fax, email or folder destination messages over the past 24 hours |
|
Network Folders |
Network folders threshold based on a specific time span or volume of documents in a folder |
|
Server Feature |
Monitoring and/or Simulation Details |
|
IIS App Pools |
IIS App Pools in a started state for each connected IIS Server and verified when the web URL is successful |
|
LDAP Lookup Simulator |
User Account LDAP lookup based on server access and display time |
|
Telco Channel Status |
Shows the following information.
|
Before you begin
The following installations are required and must be completed before you can set up the Server Dashboard.
-
Server
-
Server Monitor
-
See the Server and Client Installation Guides for more information.
Note: Device Client installation with device simulation is optional and can be configured to work with the Server Dashboard. Contact Technical Support for further assistance.
Administrators must complete the following tasks.
|
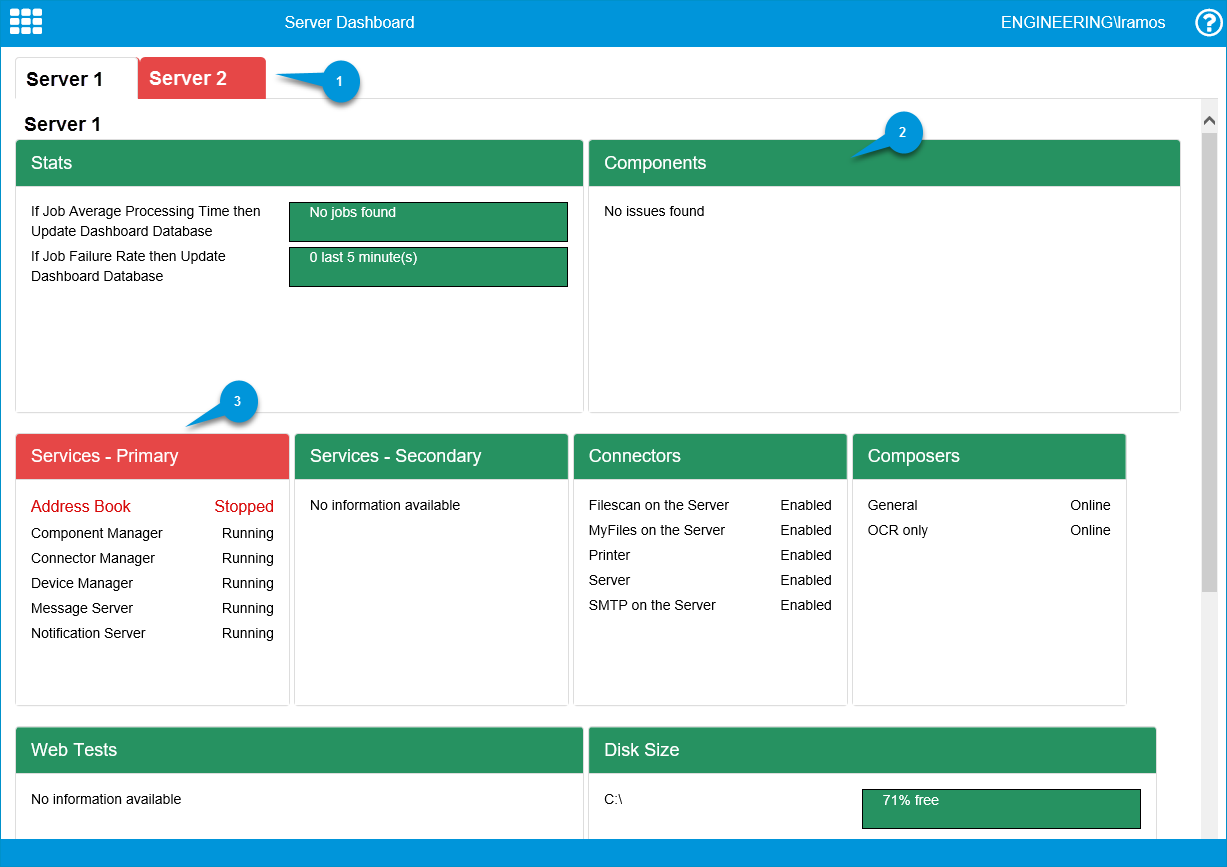
Server Dashboard Legend |
Description |
|---|---|
|
1. Server Dashboard tabs |
Use to select and view multiple Server Dashboards if multiple servers are part of your workflow configuration. Note: The tab and/or border changes to a red color if the server is experiencing any issues. |
|
2. Server Dashboard widgets |
Use to view server activity and server-related information. Note: The information displayed in the widgets is based on the Server Dashboard default or custom test criteria created. |
|
3. Server Dashboard color-coded format |
Use the following colors to view server status and determine appropriate actions to resolve issues.
|
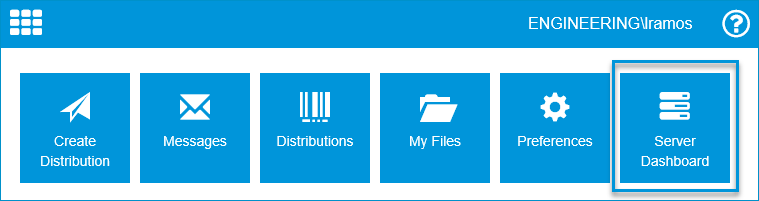
You can access the Server Dashboard by opening the WebApps application.
To access the Server Dashboard
-
Open your browser.
-
Type or paste your specific WebApps URL in the browser’s address bar.
-
Press Enter. The WebApps application appears.
-
Select the Server Dashboard tile. The Server Dashboard appears.
See WebApps > Server Dashboard tile example below.
See also
About Server Dashboard Telco Channel Status